Configure the Leader Dashboard
Learning Objectives
After completing this unit, you’ll be able to:
- Describe the prerequisites for using leader dashboards.
- Create and use leader dashboards.
A leader dashboard provides admins and managers a quick view of their team’s performance. Here’s what a typical leader dashboard looks like and what insights you can get from it.
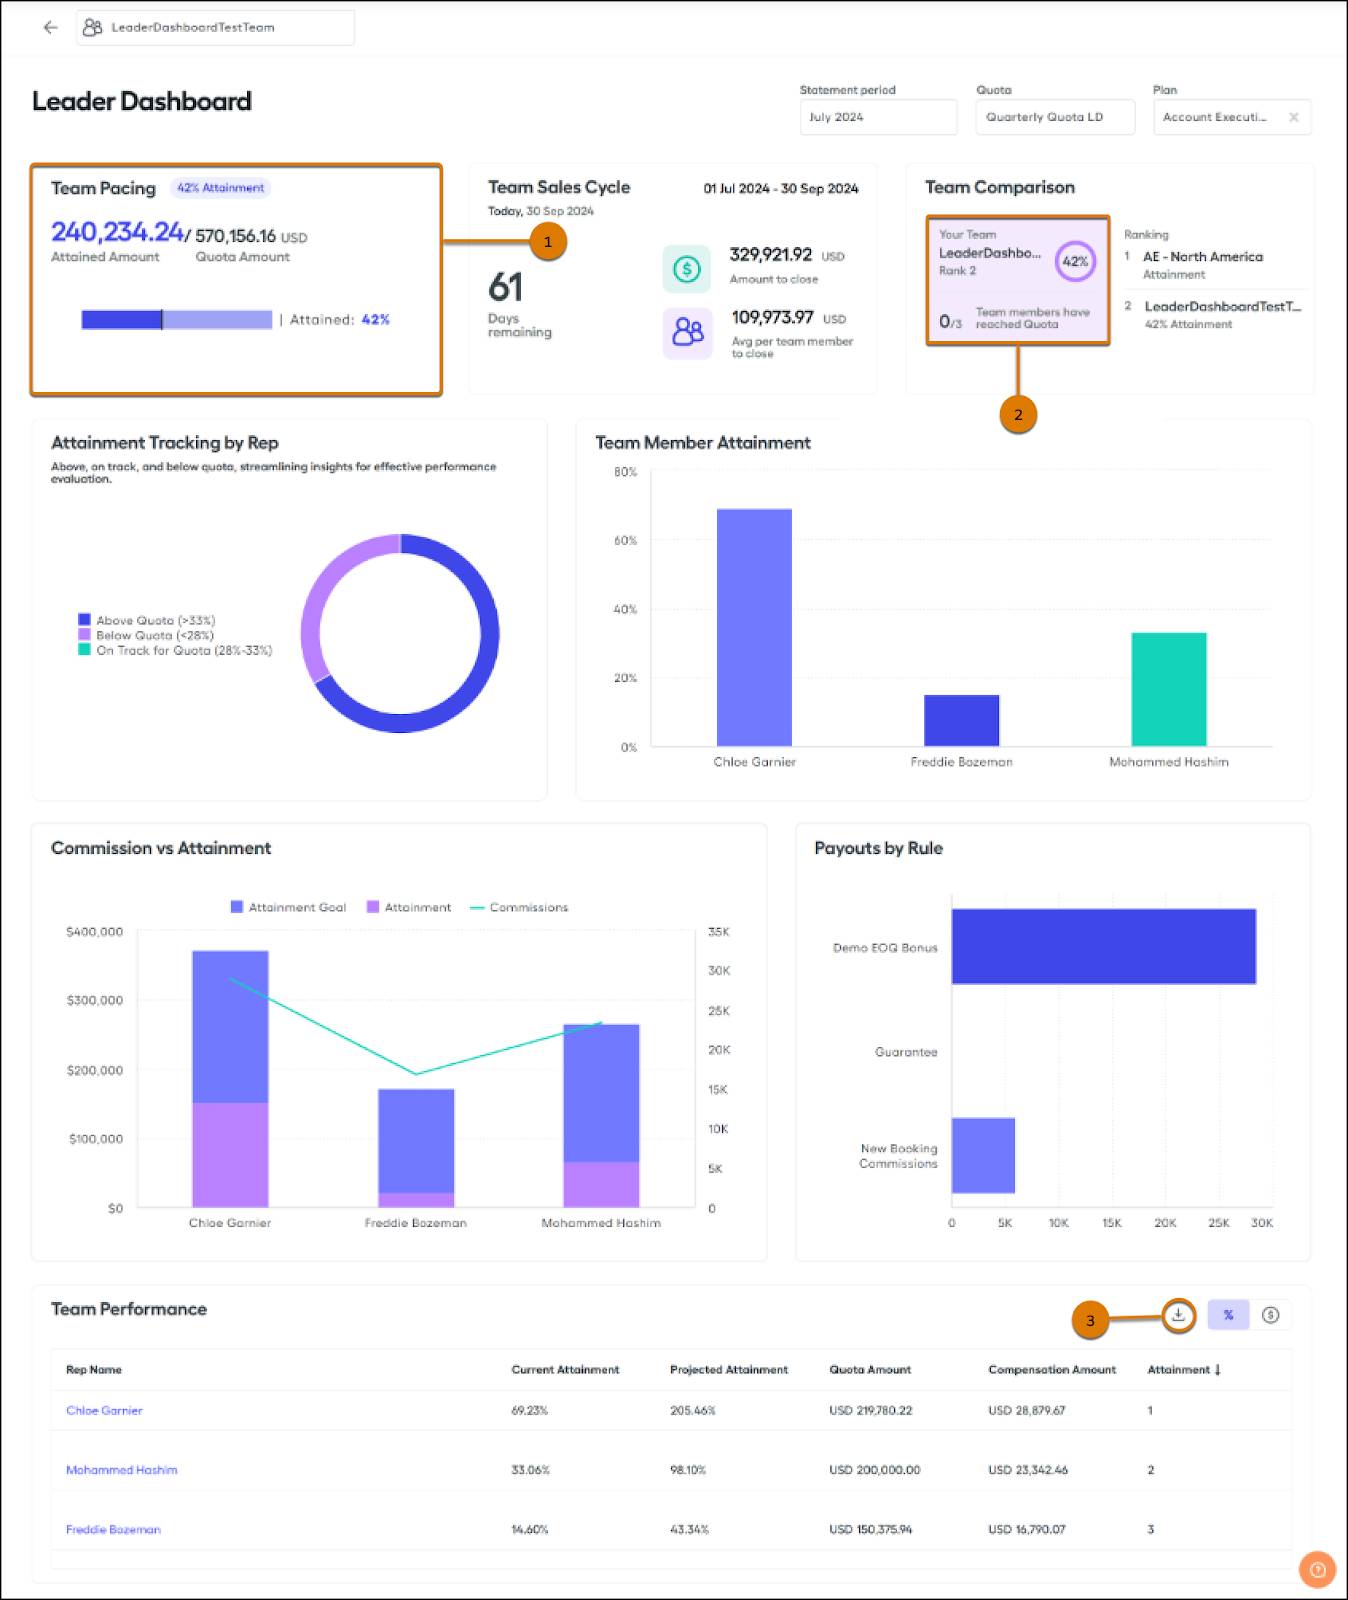
On the dashboard, you can view (1) your team members’ combined quota and attainment totals, and compare (2) rankings across multiple teams. You can also export (3) the Team Performance table and switch between currency and attainment percentages.
Prerequisites
For a leader dashboard to function correctly, ensure these prerequisites are met.
- Turn on leader dashboards by going to Admin, then Settings, and then Reporting. If a team lead manages multiple teams, turn on Cross-team comparison to show team rankings and attainment.
- Configure at least one team with a corresponding team lead.
- Make sure that the team members of that team belong to an active, visible plan and have commission statements generated. Remember that you can’t hide visible plans from reps.
- Ensure that you assign Manager roles to team leads in their user profiles.
Configuration
Leader dashboards automatically calculate the total attainment of a team, and the individual attainment percentage for each team member. To perform the attainment calculation, provide the dashboard with two numbers: a quota amount in currency and an amount of retired or attained quota in currency. Both of these calculations require configuration and you use them in commission logic for the associated plan. Also, ensure to use new calculations or calculations that are exclusive to one plan. More information on this soon. This approach prevents any issues with the leader dashboard from affecting commission rules directly. We recommend creating a ghost rule to house each of these calculations. You learn more about ghost rules later in this unit.
Quota Calculation
In Spiff, monthly, quarterly, and yearly quota tables are easy to build from the Quotas page. It's also easy to refer to them in a worksheet. A typical quota worksheet calculation looks like this: =quota(“LeaderDashboardQuota”).
For a leader dashboard to operate correctly, modify a new quota calculation to =if(PlanName = “Leader Dashboard Test”, quota(“LeaderDashboardQuota”), null).

Be careful to reference the plan name exactly as it appears in the list of plans and wrap it in quotation marks. Here’s the generic logic.
=if(PlanName = ”<insert plan name here>”, <insert quota logic here>, null)
It’s important to note that this logic causes a quota formula to return a null value on any other plan. So, make sure that each of these calculations is new or exclusive to the current plan. If you’re planning to use the quota calculation in other plans, create a new one. Remember that you can copy and paste existing formulas, even across different worksheets.
Next, tag this calculation for use in the leader dashboard.
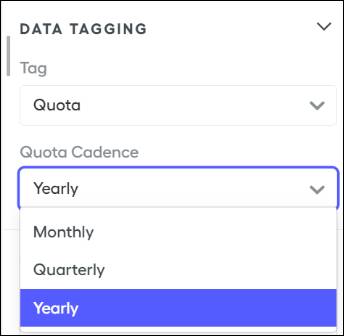
- With the calculation highlighted, expand the Data Tagging section and set the tag to Quota and set the quota cadence.
- Match the quota cadence to the length of the quota. For example, when using a monthly quota table where each month represents a full annual quota, select Yearly. The leader dashboard calculates projected attainment based on the length of the quota period.
Here’s a screenshot of the quota cadence set to Yearly.
A monthly quota where each month represents one-twelfth of an annual quota, the leader dashboard shows that one-twelfth amount when using the quota function. Use the quotas function to see the total annual quota on the leader dashboard.
Quota Attainment Calculation
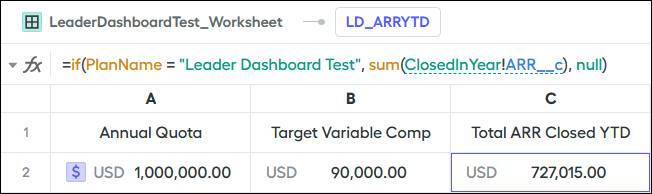
Jordan’s second calculation is a worksheet calculation that returns reps' quota attainment for a given period in currency. He can’t use an attainment percentage calculation or convert an existing attainment calculation to a currency. The leader dashboard requires a calculation that returns a currency amount. It takes that currency and uses the quota calculation designated in the tagging section to calculate the attainment percentage. For example, the leader dashboard must know that Diane has closed deals worth a specific amount in currency format in annual recurring revenue (ARR) year-to-date.
A typical calculation looks like this: =sum(ClosedInYear!ARR__c). In this formula, the sum function adds all of the ARR__c from a ClosedInYear data filter. This data filter contains a By Rep filter which returns the total ARR closed per rep for the year. You can perform the same calculation with quarterly or in-period data filters as well. Make sure to match the data filter time frame to the quota period used. Use a closed-in-quarter data filter with a quarterly quota. When using a monthly quota table to represent an annual quota amount, use a data filter that collects deals from the entire year.
Jordan gives his attainment calculation the same logic treatment as the quota calculation from earlier. This is what it looks like.
=if(PlanName = “Leader Dashboard Test”, sum(ClosedInYear!ARR__c), null)
If the quota calculation you're using is used in other plans, create a new one. Don’t forget that you can copy and paste existing formulas, even across different worksheets.
Now, tag this calculation for use in the leader dashboard. With the calculation highlighted, expand the Data Tagging section. Set Tag to Attainment and Attainment Tag to the quota function tagged previously. This links the attainment amount to the appropriate quota amount. You can repeat these steps for any number of quota and attainment calculations.
If the calculations edited in the previous steps are currently used in Jordan’s commission calculations, he’s done. He can recalculate all relevant commission statements and the leader dashboard is ready to go. It's available under the Reporting tab for Diane. But the calculations are not used in Jordan’s commission logic, so he continues to the next step and creates ghost rules for each calculation.
Leader Dashboard Ghost Rule
Now that Jordan has created the leader dashboard calculations, he uses them in commission calculations to make them available on reports. He uses a ghost rule to prevent any issues with the regular commission rules. A ghost rule is only visible to admin and finance users and is hidden from reps. In a worksheet, Jordan can set up a calculation that contains all tagged calculations as shown here.

Here is the generic logic.
=if(WorksheetName!CalculationName, 0, 0)
Jordan sets this calculation as the Payout Amount for his ghost rule. After recalculating all relevant commission statements, the leader dashboard is ready and available under the Reporting tab for Diane.
If you've tagged multiple quotas, or a team lead has members on multiple plans, they can adjust the context menus at the top to change what they're viewing.
Jordan has now empowered Diane with two brand-new tools: a reporting dashboard to track commissions and performance metrics for her SDRs, and a leader dashboard to get a quick, high-level view of her team’s overall performance. What amazing, viable insights at her fingertips!
Wrap Up
In this module, you learned how to create two types of custom dashboards in Salesforce Spiff: one to track commissions and performance metrics and another to get a quick, high-level view of your team’s overall performance. With this valuable knowledge, you're now well-equipped to convert raw data into effective insights for better business strategies.