Creare un modello
Obiettivi di apprendimento
Al completamento di questa unità, sarai in grado di:
- Spiegare in cosa consiste un modello di Einstein Discovery e quali sono i motivi per utilizzarlo.
- Illustrare gli elementi chiave di un modello di Einstein Discovery.
- Configurare e creare un modello in Einstein Discovery.
Che cos'è un modello?
Un modello è una sofisticata equazione personalizzata basata su una comprensione statistica esaustiva di risultati passati che viene usata per prevedere risultati futuri. Un modello di Einstein Discovery è una raccolta di metriche di prestazioni, impostazioni, previsioni e approfondimenti sui dati. Einstein Discovery ti guida lungo la procedura di creazione di un modello sulla base del risultato che vuoi migliorare (obiettivo del modello), dei dati raccolti a tale scopo (nella serie di dati di CRM Analytics) e di altre impostazioni che indicano ad Einstein Discovery come condurre l'analisi e comunicare i risultati.
Creare un modello
Ecco come puoi creare un modello predittivo utilizzando la serie di dati di CRM Analytics che hai preparato nell'unità precedente.
- Se stai visualizzando la serie di dati che hai caricato nell'unità precedente, fai clic su Create Model (Crea modello) e vai al passaggio 4. In caso contrario, nella pagina iniziale di Analytics Studio, fai clic su Create (Crea) e seleziona Model (Modello).

- Nella schermata New Model (Nuovo modello), fai clic su Create from Dataset (Crea da serie di dati) e poi su Continue (Continua).

- Seleziona la serie di dati opportunity_history che hai creato nell'unità precedente, quindi fai clic su Next (Avanti).

- Nella schermata Create Model (Crea modello), specifica il tuo obiettivo. L'obiettivo definisce il risultato che vuoi analizzare e riuscire a prevedere addestrando il modello. Specifica se vuoi aumentare o ridurre la portata del risultato.
In questo modulo, il tuo obiettivo è portare al massimo il numero di opportunità conseguite. In I Want to Predict (Desidero prevedere), seleziona IsWon (Conseguita). Quindi, accanto a Maximize (Aumentare), indica IsWon: TRUE (Conseguita: VERO). Accetta tutte le altre impostazioni predefinite e fai clic su Next (Successiva).

- Nella schermata Configure Model Columns (Configura colonne modello), accetta il valore predefinito (Automated (Automatico)) e fai clic su Create Model (Crea modello).

Einstein inizia ad analizzare i dati utilizzando analisi statistica, algoritmi di machine learning e intelligenza artificiale per creare il modello predittivo.

Al termine, Einstein mostra la panoramica delle prestazioni del modello.
Esaminare gli avvisi sulla qualità dei dati
Durante l'analisi e l'addestramento, Einstein Discovery esamina i dati per rilevare l'eventuale presenza di problemi di qualità come, ad esempio, impatto duplicato (denominato avviso di multicollinearità), bias potenziale, valori mancanti di frequente o diversi altri problemi. Ogni volta che viene rilevato un potenziale problema di qualità dei dati, Einstein genera un avviso sui dati. Per maggiori informazioni sugli avvisi sui dati, vedi Gestione degli avvisi sulla qualità.
Nella panoramica delle prestazioni del modello, apri Assess Deployment Readiness (Valuta preparazione della distribuzione) e fai clic sul pulsante View All Alerts (Visualizza tutti gli avvisi) per esaminare tutti gli avvisi relativi al modello.

Il riquadro Data Alerts (Avvisi sui dati) mostra ogni avviso e ti permette di scegliere se intervenire o ignorarlo. 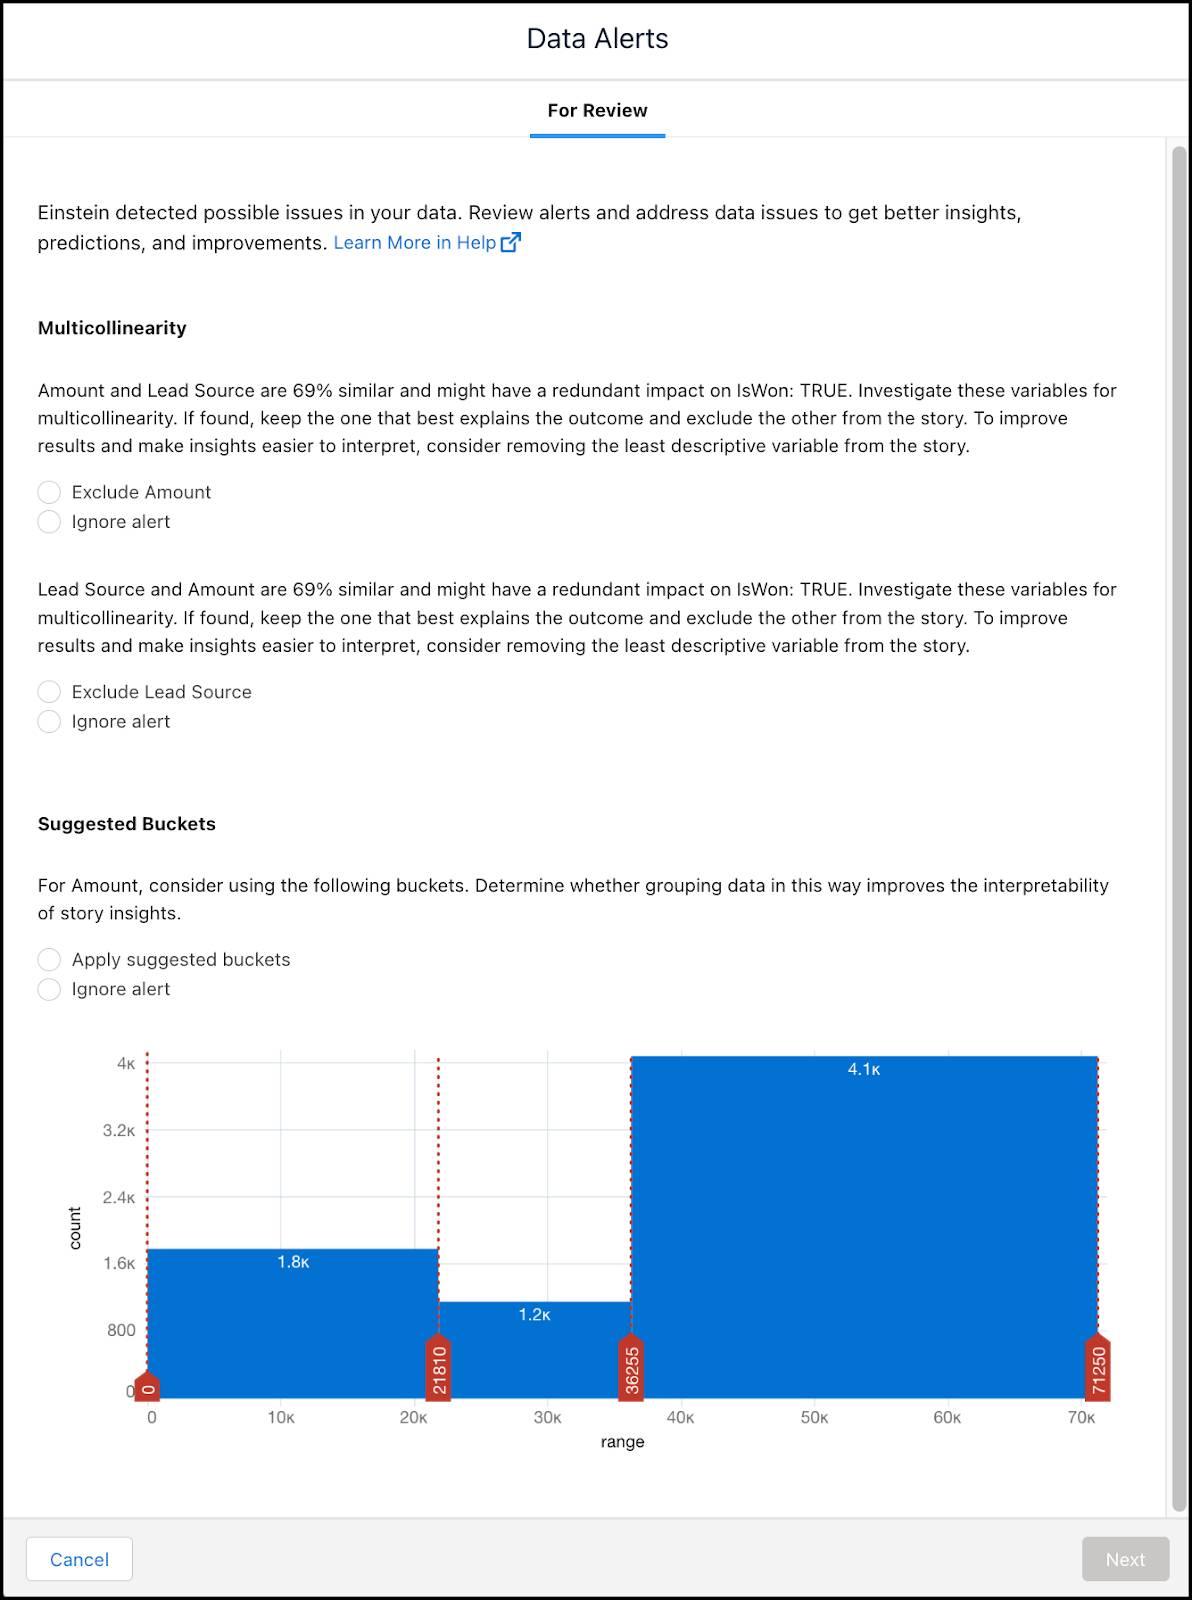
Nel nostro modello, Einstein ha rilevato un problema di multicollinearità nei dati: due o più variabili - Amount (Ammontare) e Lead Source (Fonte del lead) - sono altamente correlate e potrebbero avere un impatto duplicato sul risultato. Nel nostro caso, seleziona Ignore Alert (Ignora avviso) per Amount (Ammontare) e Lead Source (Fonte del lead).
Einstein ha rilevato anche un'opportunità di categorizzare i valori di Amount (Ammontare) in base a diversi intervalli (bucket). Sotto Suggested Buckets (Bucket suggeriti), seleziona Apply suggested buckets (Applica bucket suggeriti). 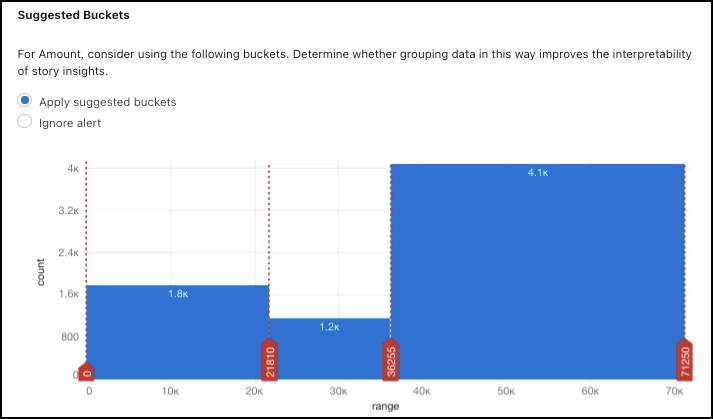
Creare una versione del modello
Fai clic su Next (Avanti). Einstein Discovery ti chiederà di descrivere la nuova versione del modello.
Ogni volta che apporti modifiche al modello devi rieseguire l'analisi e riaddestrare il modello creando una nuova versione. Nel nostro caso è necessaria una nuova versione perché Einstein deve analizzare di nuovo i dati utilizzando le impostazioni più recenti. Come hai appreso in precedenza in questo modulo, la soluzione Einstein Discovery si basa su un processo iterativo. Le versioni del modello ti aiutano a tenere traccia di ogni iterazione.
Nella casella, digita Ignore multicollinearity alerts and apply buckets to Amount (Ignora gli avvisi di multicollinearità e applica bucket ad Amount), quindi fai clic su Train Model (Addestra modello).

Einstein rianalizza e riaddestra il modello in una nuova versione. Una volta completata la nuova versione, si apre di nuovo la pagina della panoramica delle prestazioni del modello, dove potrai vedere il numero della nuova versione e noterai l'assenza di avvisi da esaminare.

Modificare le impostazioni del modello
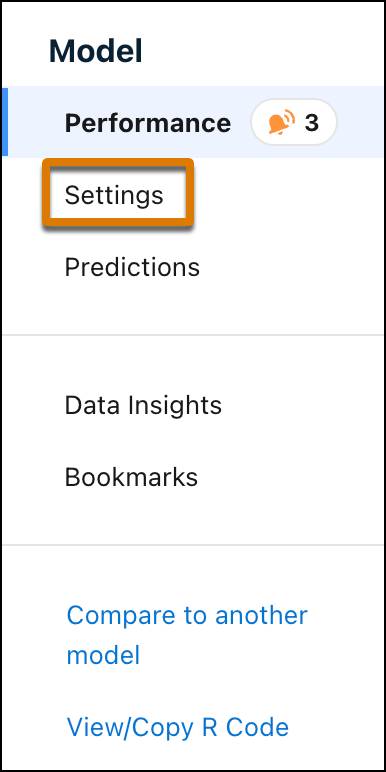
Per iniziare a personalizzare il modello, fai clic su Settings (Impostazioni).
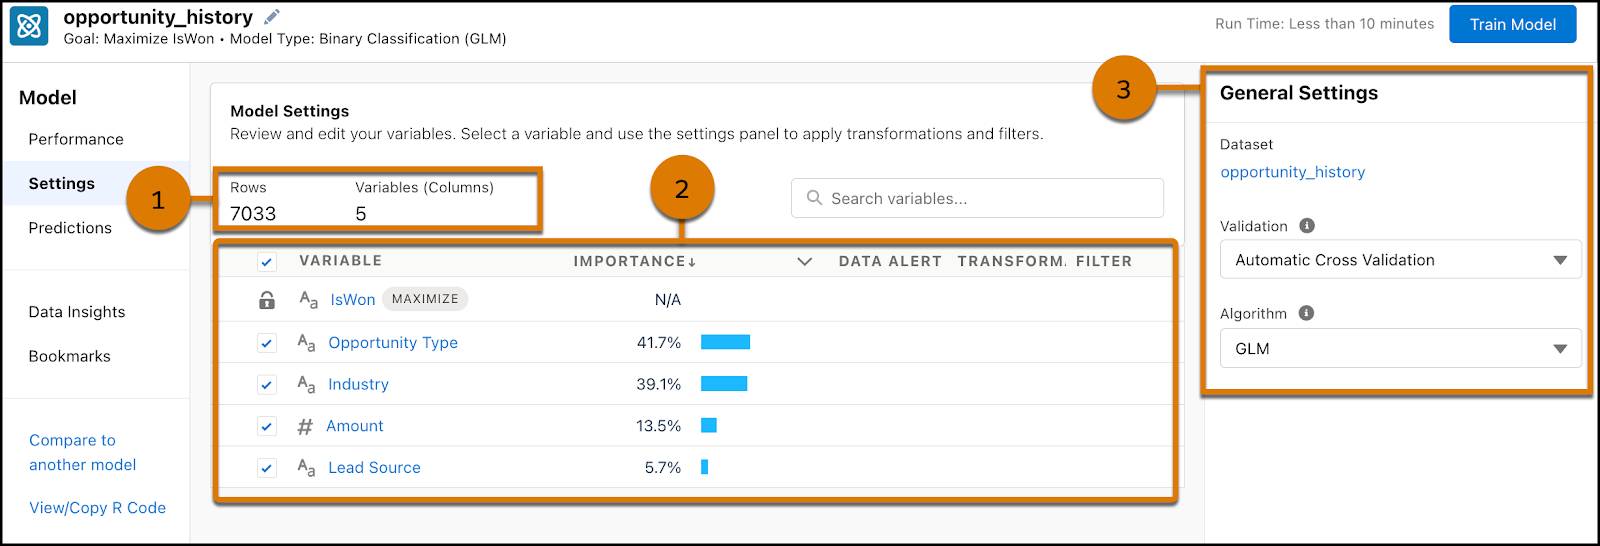
Ora puoi esaminare le impostazioni del modello.
Dettagli relativi alla serie di dati
Puoi vedere il numero di righe e colonne della serie di dati (1). In Einstein Discovery, ogni riga della serie di dati è detta "osservazione" e ogni colonna è una "variabile".
Tabella delle variabili
La tabella delle variabili (2) mostra le variabili presenti nel modello.
- La prima (IsWon) è la variabile del risultato, ossia il risultato aziendale che stai tentando di migliorare. Il tuo obiettivo è massimizzare IsWon.
- Le altre sono variabili descrittive, che esamini per stabilire se e in quale misura influenzano la variabile del risultato del modello.
- I valori riportati sotto importance (importanza) rappresentano l'influenza relativa delle variabili sul risultato previsto del modello. L'importanza indica in quale misura il modello sceglie di utilizzare la variabile per prevedere il risultato. Il livello di importanza è indicato come percentuale. Maggiore è la percentuale, maggiore sarà l'impatto. L'importanza è una metrica avanzata che considera le interazioni tra le variabili. Se due variabili sono strettamente correlate e contengono informazioni simili, il modello sceglie la variabile migliore da utilizzare.
- Usa il menu a discesa in corrispondenza della colonna Importance (Importanza) per cambiare visualizzare Correlation (Correlazione) al suo posto. La correlazione non è altro che l'associazione statistica (o "co-relazione") tra le variabili descrittive e la variabile del risultato. Il livello di correlazione è indicato come percentuale. Più alta è la percentuale, maggiore è la correlazione. Tieni presente che la correlazione non corrisponde alla causalità: la correlazione si limita a descrivere il livello di associazione tra le variabili, non l'esistenza di un rapporto di causa-effetto. Pensa alla correlazione come una misura di quanto questo campo sia in grado, da solo, di prevedere il risultato.
- Gli avvisi sui dati vengono visualizzati quando Einstein Discovery rileva nei dati la presenza di possibili problemi che richiedono una speciale attenzione.
Impostazioni generali
Nel riquadro a destra, General Settings (Impostazioni generali) (3) mostra la serie di dati usata dal modello. Puoi anche vedere, e modificare, le opzioni Validation (Convalida) e Algorithm (Algoritmo) per il modello.
Modificare le impostazioni delle variabili
Nella tabella delle variabili, fai clic su Industry (Settore). Nel riquadro a destra, configura le impostazioni della variabile selezionata. 
- Se sospetti che la variabile possa essere soggetta a bias, seleziona Analyze for bias (Analizza alla ricerca di distorsioni) (1) per attivare le funzionalità di Einstein Discovery per il rilevamento del bias. Per saperne di più, vedi Sviluppo etico di modelli con Einstein Discovery: breve panoramica.
- Seleziona un'opzione Transform (Trasforma) tra quelle disponibili (2) se vuoi trasformare i valori di questa variabile durante le analisi. Le opzioni sono: Fuzzy Matching (Corrispondenza "fuzzy"), Detect Sentiment (Rileva sentiment), Text Clustering (Clustering testo) e Replace Missing Values (Sostituisci i valori mancanti). Le trasformazioni cambiano solo i dati del modello: i valori della serie di dati rimangono invariati. Ad esempio, l'opzione Fuzzy Matching (Corrispondenza "fuzzy") corregge le leggere variazioni tipografiche nei valori di testo (ad esempio errori di ortografia o di battitura), per rendere più precise le categorizzazioni e migliorare le previsioni del modello.
- L'opzione Include Only (Includi solo) (3) mostra i valori associati alla variabile, a partire dal valore più frequente. Se deselezioni la casella di controllo in corrispondenza di un valore, Einstein può omettere il valore dall'analisi o raggrupparlo nel gruppo "Other" (Altro).
-
Histogram (Istogramma) (4) mostra la frequenza dei valori nella serie di dati.
Cos'altro puoi fare con i modelli?
Oltre a tutto ciò che hai appena appreso, puoi anche:
- Vedere la cronologia delle versioni e passare a un'altra versione.
- Aggiungere i grafici degli approfondimenti ai preferiti.
- Fare un confronto con un altro modello.
- Visualizzare e copiare il codice R.
- Rinominare il modello.
- Cambiare l'app in cui è salvato il modello.
- Eliminare un modello.
Qual è il prossimo argomento?
In questa unità hai creato un modello, risolto gli avvisi sui dati e creato una nuova versione di un modello. Nella prossima unità valuterai il modello.
Risorse
- Guida di Salesforce: Creazione e gestione di modelli
- Guida di Salesforce: Gestione degli avvisi sulla qualità