Create an App and a Lens
Follow Along with Trail Together
Want to follow along with an expert as you work through this step? Take a look at this video, part of the Trail Together series.
(This clip starts at the 3:55 minute mark, in case you want to rewind and watch the beginning of the step again.)
Create an App
A CRM Analytics app is a curated set of analyses and paths through your data, plus powerful tools for spontaneous, deep explorations. CRM Analytics starts with apps. Apps organize data projects, run presentations directly from dashboards, and control asset sharing.
Now that you’ve signed in to your CRM Analytics-enabled Developer Edition org and connected it to Trailhead, you’re ready to get started.
- If you’re not already there, open your Developer Edition org. And if you see the Welcome to Lightning Experience window, you can close it.
- From the App Launcher (
 ), find and select Analytics Studio. (Analytics Studio opens in a new tab. Don’t close the first tab. You do work in it later in this project, so keep both tabs open.)
Note: If Analytics Studio doesn’t open, check to see if your pop-up blocker is on. If so, change the setting to allow pop-ups from your org.
- In Analytics Studio, click Create, and then select App.
- Click Create Blank App.
- Click Continue.
- Enter
My Amazing Appas the name of your app.
- Click Create.
You created an app, and it displays in a new tab. Now, let’s build some CRM Analytics assets for your app.
Create a Lens
A lens is a visualization of data in a dataset. You use the lens to explore data graphically and to build queries for a dashboard.
- Click the Analytics Studio tab to return to the CRM Analytics Home page.
- Click Browse, and then click Datasets.
- Select the DTC Opportunity dataset. A tab opens with a new lens for exploring the dataset.
Note: If an error occurs while opening a dataset or dashboard, don’t worry. DE orgs sometimes encounter stale data that just needs a refresh. Return to the CRM Analytics Home page, refresh your browser, and click the DTC Opportunity dataset again. You’re now ready for exploration!
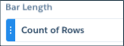
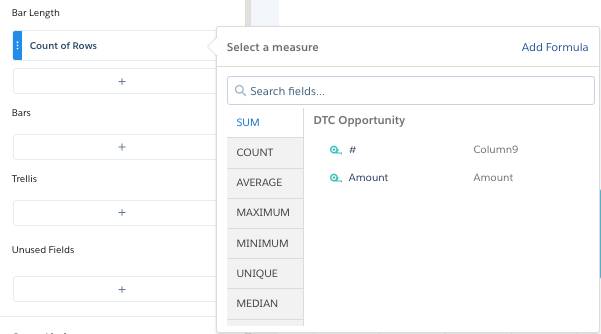
- In the New Lens tab, under Bar Length click the words Count of Rows (not the down arrow next to the words).
- Click Sum, and then select Amount.
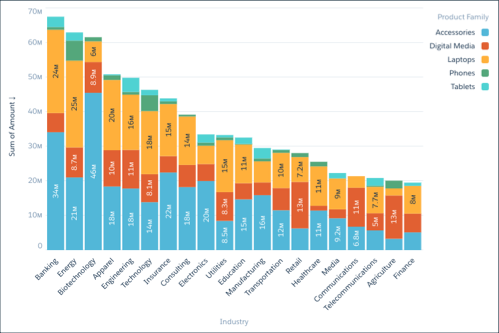
- Under Bars, click the plus sign (+), and then select Industry.
- Under Bars, click the plus sign (+) again, and then select Product Family.
- Under Bar Length, click the arrow next Sum of Amount, and select Sort Descending.
- To the right of the chart, click the Charts icon (
 ).
).
- Select the Stacked Column chart icon (
 ) to create a Stacked Column chart.
- Click
 to save your lens.
- For the title of your new lens, enter
My Amazing Lens, and then select App -> My Amazing App.
- Click Save.
Now that you’ve created an app and a lens, you’re ready to create a dashboard. You’ll also create an interactive chart, list widget, and a table created from a conversational query.

Resources
- Salesforce Help: Manage and Share CRM Analytics in Apps
- Video: Introduction to the CRM Analytics Explorer
- Trailhead: CRM Analytics Desktop Exploration
- Salesforce Help: Learn to Use Explorer