Create a Threat Model
Learning Objectives
After completing this unit, you’ll be able to:
- Describe how to define security objectives.
- Create a basic data-flow diagram.
Agree on Security Objectives
After you’ve assembled your threat modeling team, it’s time to decide on the security objectives of the system you’re about to analyze. Security objectives are the protections your system must maintain.
A full threat model considers many kinds of threats, including insider misuse, accidental failures, and environmental conditions. This module, however, focuses mainly on external threats so you can learn the core process without trying to account for every possible source of risk at once.
To define security objectives, focus on three things.
-
Assets: What is valuable?
-
Attacker goals: What might someone try to access, change, expose, or disrupt?
-
Assumptions: What conditions must be true for your protections to work?
These three are directly connected. The assets you identify determine what needs protection, attacker goals help you understand how those assets might be targeted, and assumptions define the conditions your system relies on to stay secure.
Explore a Scenario
Imagine you own a small shop. Your assets include cash, inventory, and customer records. Your security objective is to keep those assets from being stolen, damaged, or exposed. To protect those assets, you install a door lock, keep customer records in a locked filing cabinet, and install a security camera. Your assumptions are the conditions those protections depend on.
A malicious person’s goals could be stealing cash, damaging property, or taking private information. You’ve assumed the door lock is strong enough to keep unauthorized people out, the employees with keys will use them responsibly, and the security camera is active and recording when the shop is closed.
Threat modeling helps make those assumptions visible so you can ask what happens if they are wrong. Together, the assets, protections, likely goals, and assumptions help you decide whether your security objectives are realistic and whether your protections can be relied on.
Understand Why Assumptions Matter
Every system is built on assumptions–conditions you believe to be true for the system and its protections to work as expected. Threat modeling helps make those assumptions visible so the team can question them before they become hidden sources of risk.
Types of assumptions to consider:
-
Infrastructure: This service is internal-only.
-
Trust boundaries: This API requires authentication.
-
Identity and permissions: Only admins can perform this action.
-
Data classification: This environment contains no production data.
-
Automation: This agent will not act on malicious input.
Documenting and validating these assumptions provides context for your threat model and helps others understand how your system is expected to behave. The table shows how assets, attacker goals, security objectives, and assumptions connect during threat modeling.
Asset |
Attacker Goal |
Security Objective |
Assumption Example |
|---|---|---|---|
Customer Database |
Read, modify, or exfiltrate data |
Protect the confidentiality and integrity of customer data |
Database traffic is encrypted |
Proprietary Source Code |
Steal or alter code |
Prevent unauthorized access or tampering |
Repository access requires authentication |
Microservice API |
Send unauthorized requests or misuse functionality |
Ensure only authorized services can access |
API requests are authenticated |
Production Server OS |
Execute unauthorized actions or disrupt operations |
Maintain system integrity |
Systems are patched and hardened |
The threat model then helps test those assumptions conceptually by asking what happens if they are wrong.
Describe the System with a Data-Flow Diagram
After defining your security objectives, the next step is to represent the system in a way that supports analysis. You can’t effectively analyze risk without understanding how the system is built, and in practice you may need to build that understanding while you model it.
A data-flow diagram (DFD) is a documented way to understand how components interact, where data moves, and where risks can emerge. A DFD shows how data moves between parts of your system so you can focus on interactions, boundaries, and the points where things can go wrong.
Capture the diagram in whatever way works for your team (like a drawing tool or a whiteboard). The important part is that it can be shared and understood by others.
Define Your Scope
When creating your data-flow diagram, you must decide what part of the system you are modeling. You cannot realistically map everything. Trying to do so will make the diagram too complex to be useful. Instead, focus on the following.
- Define your scope before you begin.
- Home in on a specific part of the system.
- Identify the boundaries where risk matters most.
To build a useful diagram, you need a few core components that define how the system works, how data moves, and where data crosses from level of trust to another. In cybersecurity, trust often refers to how much access or authority something has within the system.
Data Flow
This shows how data moves between components. Each arrow represents a single direction of flow.
Entity
This represents users, systems, or external components that interact with your system.
Process
Represents how data is handled or transformed. Processes are often where data crosses boundaries or where decisions are made.
Data Store
Represents where data is stored. Data stores should only connect to processes, not directly to entities.
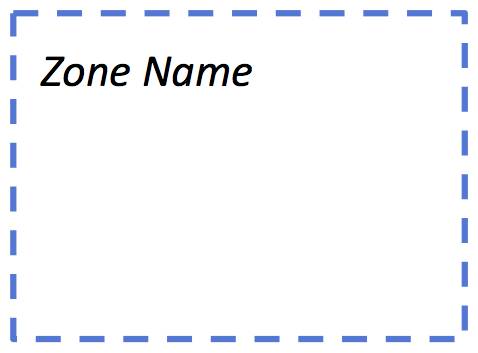
Trust Boundary (Zone)
Shows where the level of trust changes. These often align with architectural zones, such as internet-facing systems, internal services, or data layers.
Trust boundaries are especially important because they mark where assumptions about the system change. Most security issues arise when data crosses from a less trusted part of the system into a more trusted one. That’s why threat modeling often focuses on these boundaries. They are where misuse, unexpected input, or unauthorized access is most likely to occur.
Not all parts of a system have the same level of access or authority. In cybersecurity, components that can access sensitive data, execute commands, or make changes to systems are typically treated as higher trust environments. For example, an internal administrator account has more privileges than a public website visitor, and an agent with terminal access has more authority than one limited to summarizing text.
Risk increases when data moves between components with different trust levels or access privileges. This table shows examples of how trust boundaries typically appear across systems and boundaries.
Modern architectures may also include automated agents and external AI services, which should be treated as their own trust zones based on the access they have.
Low Trust Boundaries |
High Trust Boundaries |
|---|---|
The internet |
Your internal network |
User-controlled input (for example, browser or client app) |
Internal application services |
External systems and third-party services |
Internal data stores and systems |
Third-party LLM API (External Agent) |
Locally hosted model (Internal Agent) |
External MCP server |
Internal services with controlled access |
Agent with read-only access |
Agent with file system or terminal access |
These examples show where trust changes in a system and where you should ask what the system might do that you didn’t intend.
How to Start a Data-Flow Diagram
You’ve done your preparation. You’ve assembled your team and defined your security objectives. You’re ready to draw the first shape of your data-flow diagram. Start by focusing on a specific slice of the system rather than trying to diagram the entire architecture at once. But, as any artist knows, a blank canvas can be daunting. How in the world do you start?
There’s a simple approach! Begin with a basic set of components: one entity, one trust boundary, one process, and one data store. Connect them together to form a simple starting diagram.
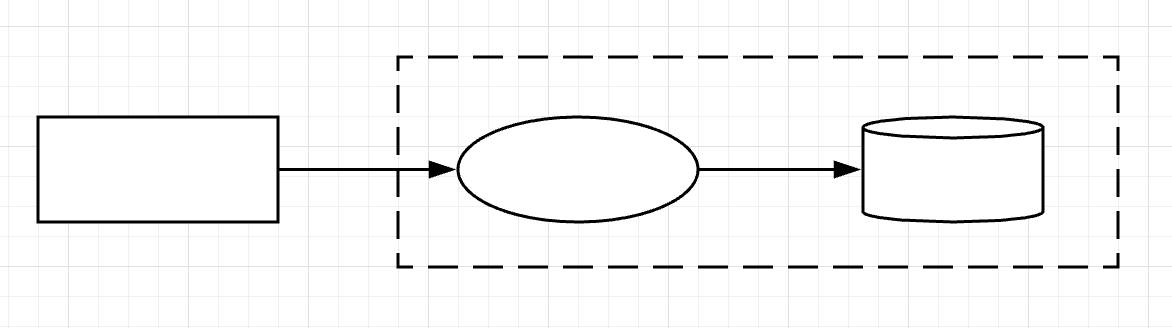
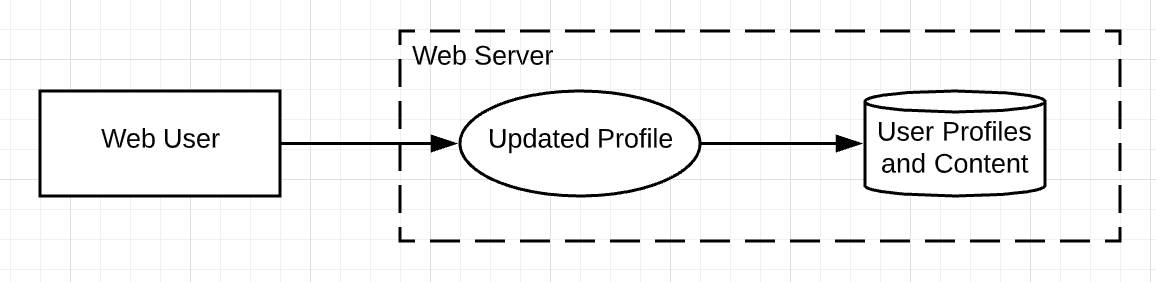
Now, how do you name these components? Focus first on the entity (the rectangle). Is the entity a user in a web browser? If so, label the entity as such and make the process (the oval) one of the actions the user performs. Then label the data store (the cylinder) based on how that data comes to rest. Finally, draw the trust zone (the dotted-line) as the web server that contains the process and the data store, as shown in this diagram.
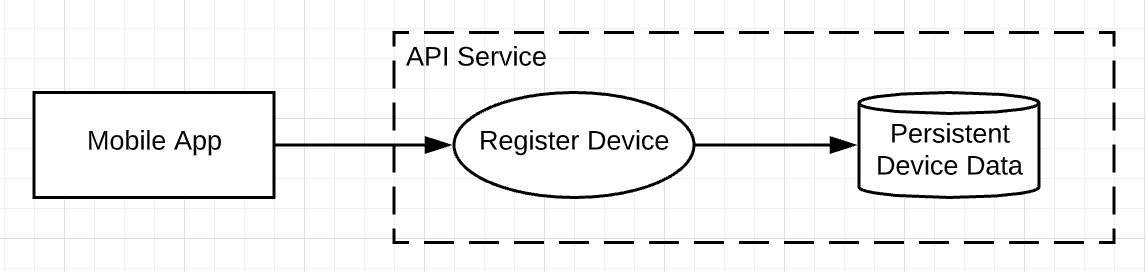
Is the entity a mobile app? If so, identify the entity as such (the rectangle). Then describe the process that was performed, such as registering a device (the oval), and label the data store (the cylinder). Finally, draw the trust zone and label it as the API service that invoked the register device process.
From this seed of a diagram, you can move things around and add other components—entities, processes, and data stores—until you have a complete representation of a system. Connect the components with arrows to indicate the direction in which important data flows.
Explore a Complete Data Flow Diagram
Once you understand the basic components and how to connect them, you can use them to represent a larger slice of the system. Here’s an example of a complete data-flow diagram.
This diagram represents a blogging web application with two types of users: an authenticated site administrator and a blog author. The numbered arrows represent data flows, especially where data crosses trust boundaries. The highlighted section shows the threat modeling scope is focused on authentication and credential handling within the web server. Everything outside the web server boundary is the internet.
Rather than showing the entire architecture, the diagram focuses on a specific slice of the system. This illustrates how threat modeling centers on the components and interactions that matter most for security analysis.
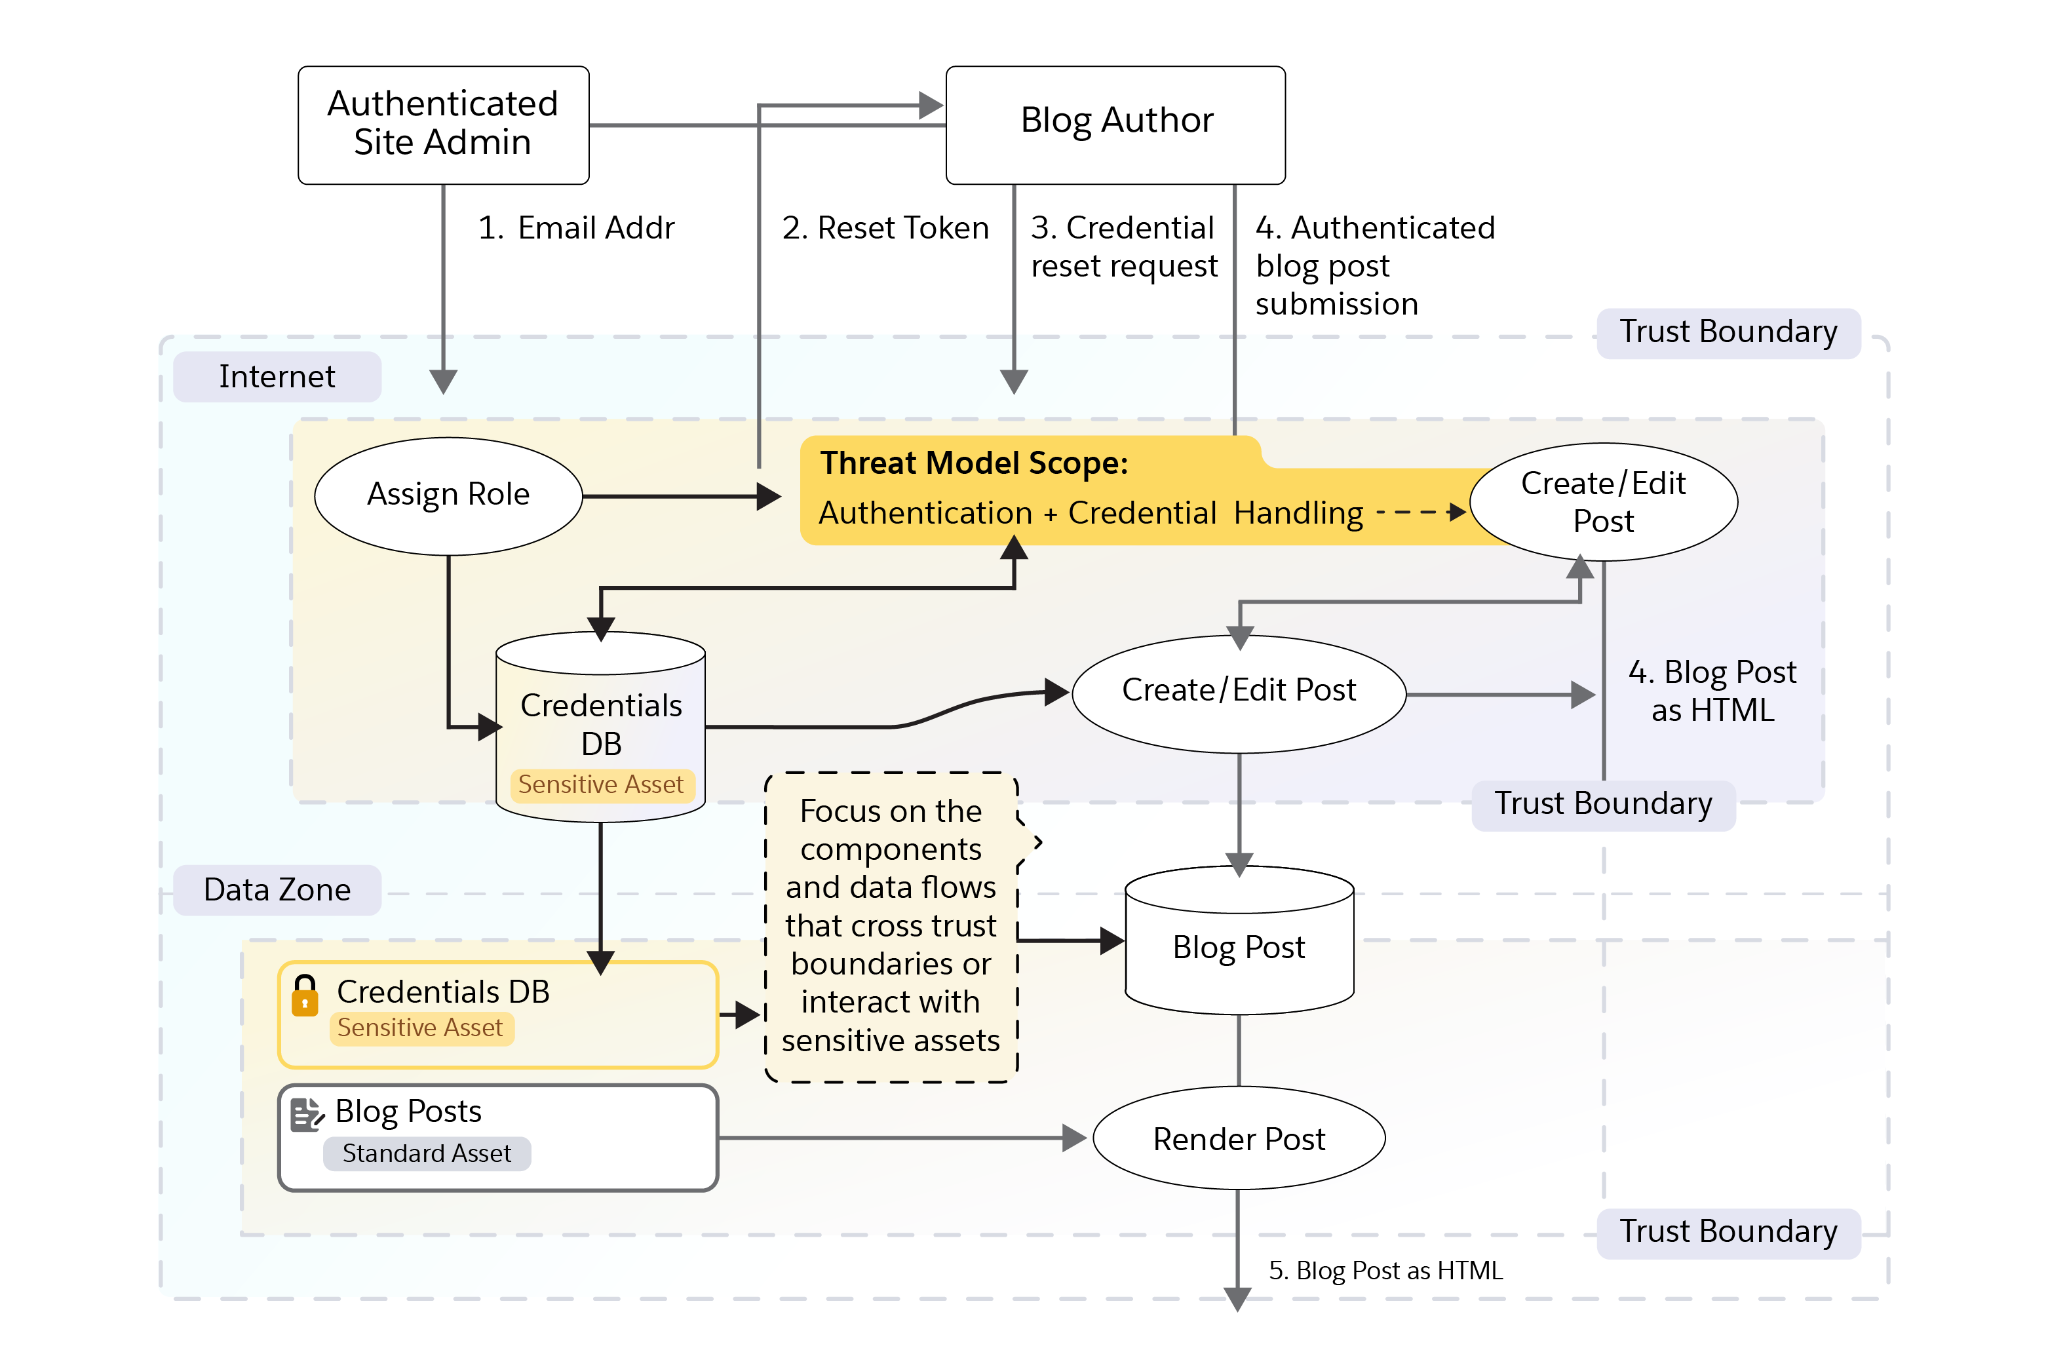
In the diagram, an authenticated administrator creates a blog author by entering the author’s email address (1). The system sends the author a reset token (2), which the author uses to set a passphrase (3). After authentication, the author can create or edit a blog post (4). The system then renders the post as HTML for readers (5).
The administrator and author entities exist outside the web server trust boundary, while the highlighted area shows the threat modeling scope focused on authentication and credential handling.
Now that you can see how the system is represented, the next step is to describe how it behaves.
Writing Stories
A data-flow diagram shows how data moves through the system. A short narrative helps explain what is happening at each step and why it matters. Start by describing how someone interacts with the system. Walk your team through the experience step by step and ask:
- What is the user trying to do?
- What assets are involved?
- Where does data enter the system?
- Where is it transformed, stored, or sent elsewhere?
- What could go wrong at each step?
These stories help the team connect system behavior to possible misuse, failure, or abuse. They also make it easier to identify the interaction points where risks are most likely to appear.
You can write different kinds of stories:
-
Abuse: How someone might intentionally exploit a feature
-
Misuse: How a legitimate user might accidentally or intentionally misuse the system
-
Negligence: What happens if a user or system component acts carelessly
-
Agent bypass: How an automated agent might skip required checks or approvals
These stories may be hypothetical, but they are grounded in how the system could realistically behave. They help make the data-flow diagram more complete and accurate.
Ready to Move On
How do you know when your data-flow diagram is complete? The following questions are a good start.
- Did you label all processes and entities?
- Is the overall representation of the system accurate?
- Did you include all trust boundaries?
- Does every data flow begin with an entity or process and eventually lead to another entity or data store?
- Do any flows go nowhere or outside of your project? If so, note the other scope or system as an entity.
- Have you added arrows to the data flows?
- Have you numbered interaction points?
- Can you identify the key assumptions this diagram relies on?
- Can someone use this diagram to identify what needs protection?
- Are potential risk points clearly marked and numbered for reference?
A well-constructed data-flow diagram helps teams understand how their system works, identify what needs protection, make assumptions visible, and pinpoint where risks may occur.
In the next unit, discover who and what you might be protecting your organization from.
Resources