Manage Spiff Dashboards
Learning Objectives
After completing this unit, you’ll be able to:
- Create, edit, and delete Spiff dashboards.
- Explain the considerations for sharing custom reports and dashboards based on user roles.
Before You Start
Before you start this module, consider completing the following recommended content.
-
Salesforce Spiff Basics
-
Commission Management with Salesforce Spiff
-
Introduction to Salesforce Spiff Designer
Power Your Business with Data Insights
Data is the heartbeat of any business. Data gives businesses the power to understand what’s working, what’s not, and where there’s room to grow. With solid information backing decisions, businesses can ditch the guesswork and make smarter, more strategic moves. But here’s the catch—having mountains of data means nothing if you can’t make sense of it. Without the ability to uncover trends and insights, all that data can become a burden. That’s where efficiency comes in. The magic of turning raw data into viable information and effective visualizations. That’s the real power of data, and Salesforce Spiff captures this power through its custom and visual reports and dashboards.
In this module, you learn about the two types of custom dashboards that Salesforce Spiff offers, and how to manage them.
Meet Jordan Pine, the Salesforce admin at Ursa Major, a Southwest-based US supplier of solar components and systems that uses Salesforce Spiff to manage sellers’ commissions. Jordan teams up with Diane Gonzalez, the new sales manager, to set up dashboards to keep her current with the information she needs. Diane needs two dashboards: one to track commissions and performance metrics for her sales development representatives (SDRs), and another to get a quick, high-level view of her team’s overall performance.
Luckily for Jordan, the reports for the SDR dashboard are ready to go. All he has to do is pull them into a dashboard and share it with Diane. Follow along as he sets up these dashboards.
Create a Dashboard
Dashboards are a fantastic way to keep all your favorite reports in one central spot. No more jumping back and forth between individual reports to find the data you need. Instead, group all the reports relevant to a team or plan for quick, streamlined access.
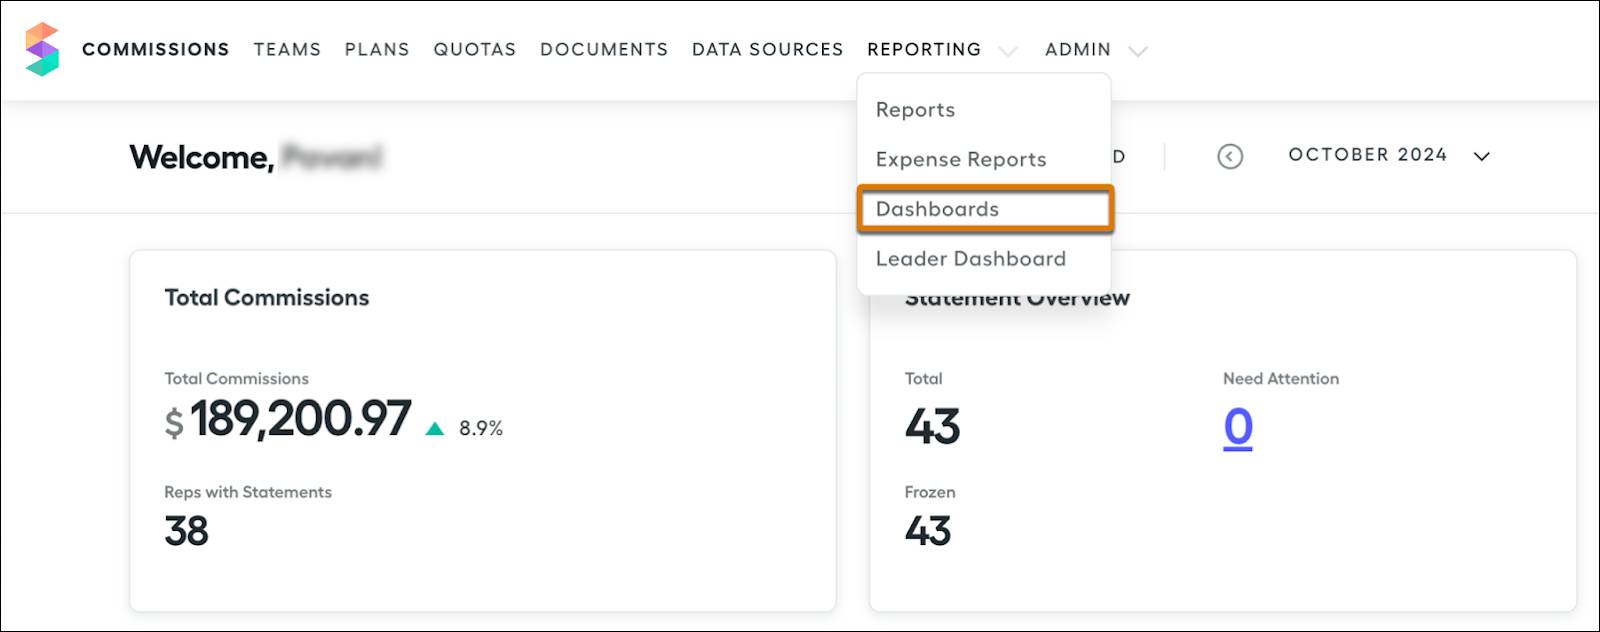
To access your dashboards, just click Reporting, and select Dashboards.
On the Dashboards page, you can find all your existing dashboards, plus the option to create new ones.
Here’s how to set up a new dashboard.
- Click New Dashboard to open the dashboard builder.
- Name your dashboard to identify it easily.
- Select the reports you want to include in the dashboard by clicking Add Tile. Review the list of available reports, including any custom or visual reports created earlier.
- Add the selected reports to the dashboard by clicking Add Report.
- Click Save. Review the dashboard to see a tile for each report you selected.
- To analyze the data further, click Learn More for any tile.
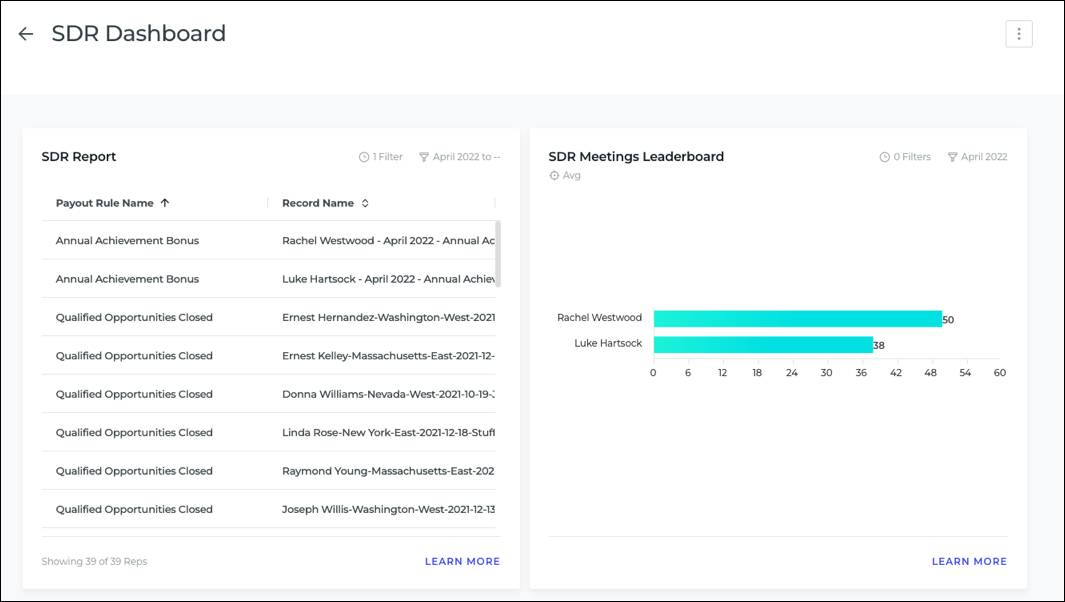
And that’s it, the dashboard is ready!
Jordan follows these steps to successfully create an SDR dashboard for Diane. He checks her first requirement off the list, but his responsibilities aren’t over. Diane realizes that she doesn’t need the information on commissions per deal for the last year. She also wants to add a description to clarify the purpose of the dashboard, especially because she wants to share it with others. She shares this feedback with Jordan, who gets ready to address it.
Edit a Dashboard
Editing a dashboard is easy. Here’s how.
- Open the dashboard you want to edit.
- Click
 and select Edit Dashboard.
- Make the necessary changes. You can add a description or delete unwanted reports. You can also add new reports by clicking Add Tile.
- Save your changes.
Delete a Dashboard
Deleting a dashboard is quick and simple. Navigate to the dashboard's home screen, where all your dashboards are listed. Find the specific dashboard you want to remove. Click  and then
  . This step deletes the dashboard immediately, so make sure you're certain before taking this step. It’s a handy way to keep your dashboard list organized. This image shows a list of dashboards with the option to delete for each dashboard.

Diane is happy with the final version of the dashboard, so she signs off on it. The dashboard is now streamlined and focused on the most relevant metrics. Diane now requests Jordan to share the dashboard with her so she can start using it to track her SDRs’ performance and share insights with her team.
Share a Dashboard
When it comes to sharing dashboards, there are a few key things to keep in mind.
In Spiff, users with Admin or Finance roles have full access to all reports and dashboards. They can also share custom table reports, visual reports, and dashboards with users with Manager or Editing Manager roles. That said, users with these roles have limitations as well. They can’t edit existing dashboards, and they only have read-only access to custom tables and visual reports. They also can’t view accounting reports or standard reports.
Additionally, managers and editing managers can only see data related to their own teams. Team structure visibility applies to reports and dashboards. For example, if Diane oversees team B and Jordan shares a company-wide report covering teams A, B, and C, she only sees data for team B. Similarly, if Jordan shares a report with someone who has access to teams A and C, they only see data for those teams. By keeping these sharing rules in mind, you can ensure that the appropriate people have access to the appropriate data.
To share a dashboard, open the dashboard, and select Share in the options menu. This opens up a window that you can use to add any user to this dashboard with the appropriate role.

Diane had two key requirements for tracking her team’s performance. The first was to create an SDR Dashboard, which Jordan has now completed. The second requirement is to provide a high-level overview of her team’s overall performance. Jordan can achieve this by setting up a leader dashboard, a powerful tool for gaining comprehensive insights. This is exactly what you learn in the next unit. So, keep going!