Explore and Share Metrics in Tableau Next
Learning Objectives
After completing this unit, you’ll be able to:
- Explore insights in your metric.
- Follow and share metrics.
- Set up metrics to track your goals.
Explore Insights
Every metric in Tableau Next has one or more insights that you can explore to learn more about your data. Think of these insights as the “why” behind the numbers. When you open a metric, you see a Discover Insights panel with suggested questions. Simply click these questions to reveal more information.
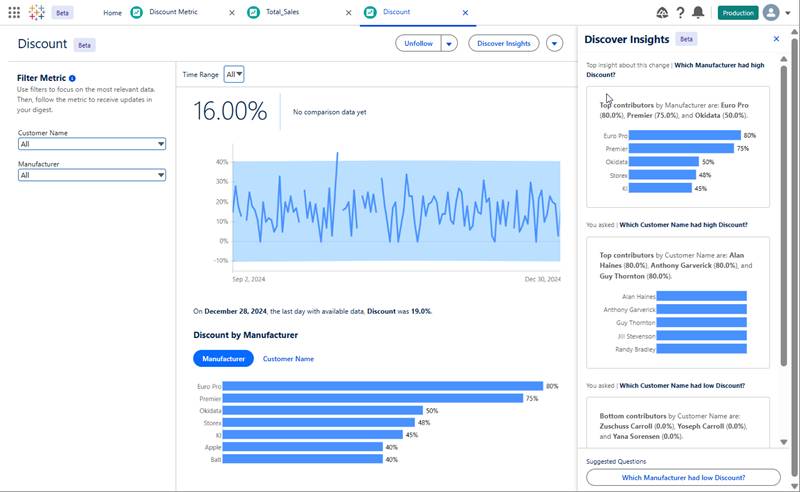
For instance, if you’re looking at a sales metric, you might see a suggested question like, “Which Manufacturer had the lowest Discount?” Click the question to open the insight. You can also add filters to focus on the data that matters most to you.
Follow and Get Notified About Metrics
Following metrics in Tableau Next is like having a personal data assistant. Follow metrics to get insights about changes to your data on your home page in Tableau Next. You can also add others to follow your metrics. When a coworker adds or removes you as a follower of a metric, Tableau Next notifies you.
When you follow two or more metrics, Tableau Next provides an AI-generated summary of the insights related to those metrics. This summary is created using natural language, so you get a clear and concise overview. Metrics with higher-impact insights, such as unusual changes, are front and center. The summary appears on your home page (and in Slack digests, when available).
Copy or Download a Metric Snapshot
There are two quick and easy options for sharing metrics. You can download a snapshot image of a metric to a .png file or copy it to your clipboard. Both options capture the metric with your filters and the latest data. Remember, the image includes your personal view with the latest data, so be mindful of any confidential information before sharing.

Share Metrics in Slack
Collaboration is key, and Tableau Next makes it easy to share metrics with your team in Slack. To learn more, see Tableau Next in Slack: Quick Look.
Create Goals
Setting goals in Tableau Next helps you track progress toward specific targets. When you create a goal, it’s visible to anyone who views that metric. All users can create, edit, or delete a goal. Goals are based on the filters applied to the current metric and the time range selected.
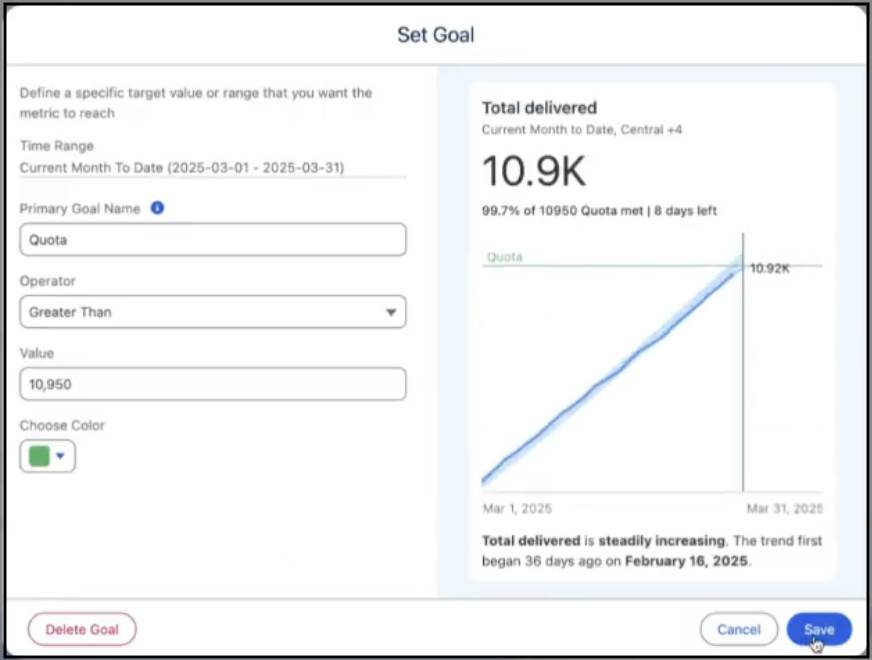
For example, if you’re tracking sales for the quarter, you can set a goal from the beginning to the end of the quarter. When the goal’s time period has passed, it doesn’t recur, so you need to set a new goal at the beginning of each period.
After you create a goal, you can track progress in your Tableau Next digests and on your Tableau Next home page.
Summary
Now that you know how to create and manage metrics in Tableau Next, you can use them to consistently track your KPIs and gather meaningful insights to help you make data-informed decisions.