Get to Know the Journey Analytics Dashboard in Marketing Cloud Engagement
Learning Objectives
After completing this unit, you’ll be able to:
- Discuss reports and components of the Journey Analytics dashboard.
- Use and Customize Engagement Reports on the Overview tab.
- Use and Customize Content Reports on the Content tab.

Meet the New Journey Analytics Dashboard
Wouldn’t it be great if you could go to one place to find out if and how consumers are engaging with your messages and content across channels?
With the integration of Salesforce Marketing Cloud Engagement and Google Analytics 360, you can now access cross-channel and content engagement data for each customer journey in Journey Builder. This lets you track your marketing campaign’s effectiveness easily.
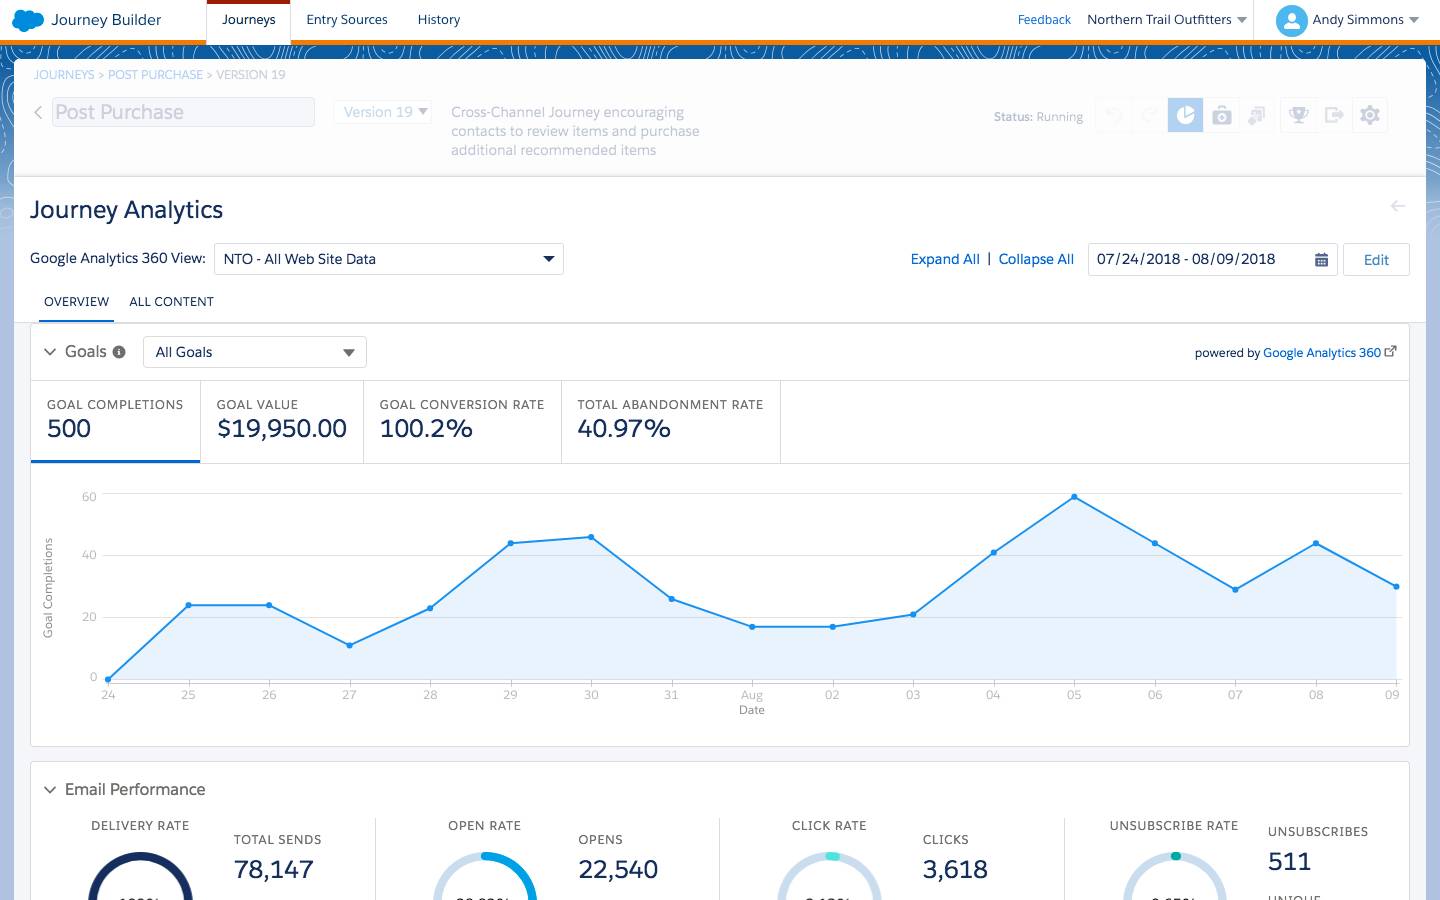
So, to help you unlock the power and insights of the new dashboard, let’s drill into each of the following components further.
- Google Analytics Goal tile
- Email Performance tile
- Google Analytics Ecommerce tile
- Google Analytics Usage tile
- Google Analytics Content tab
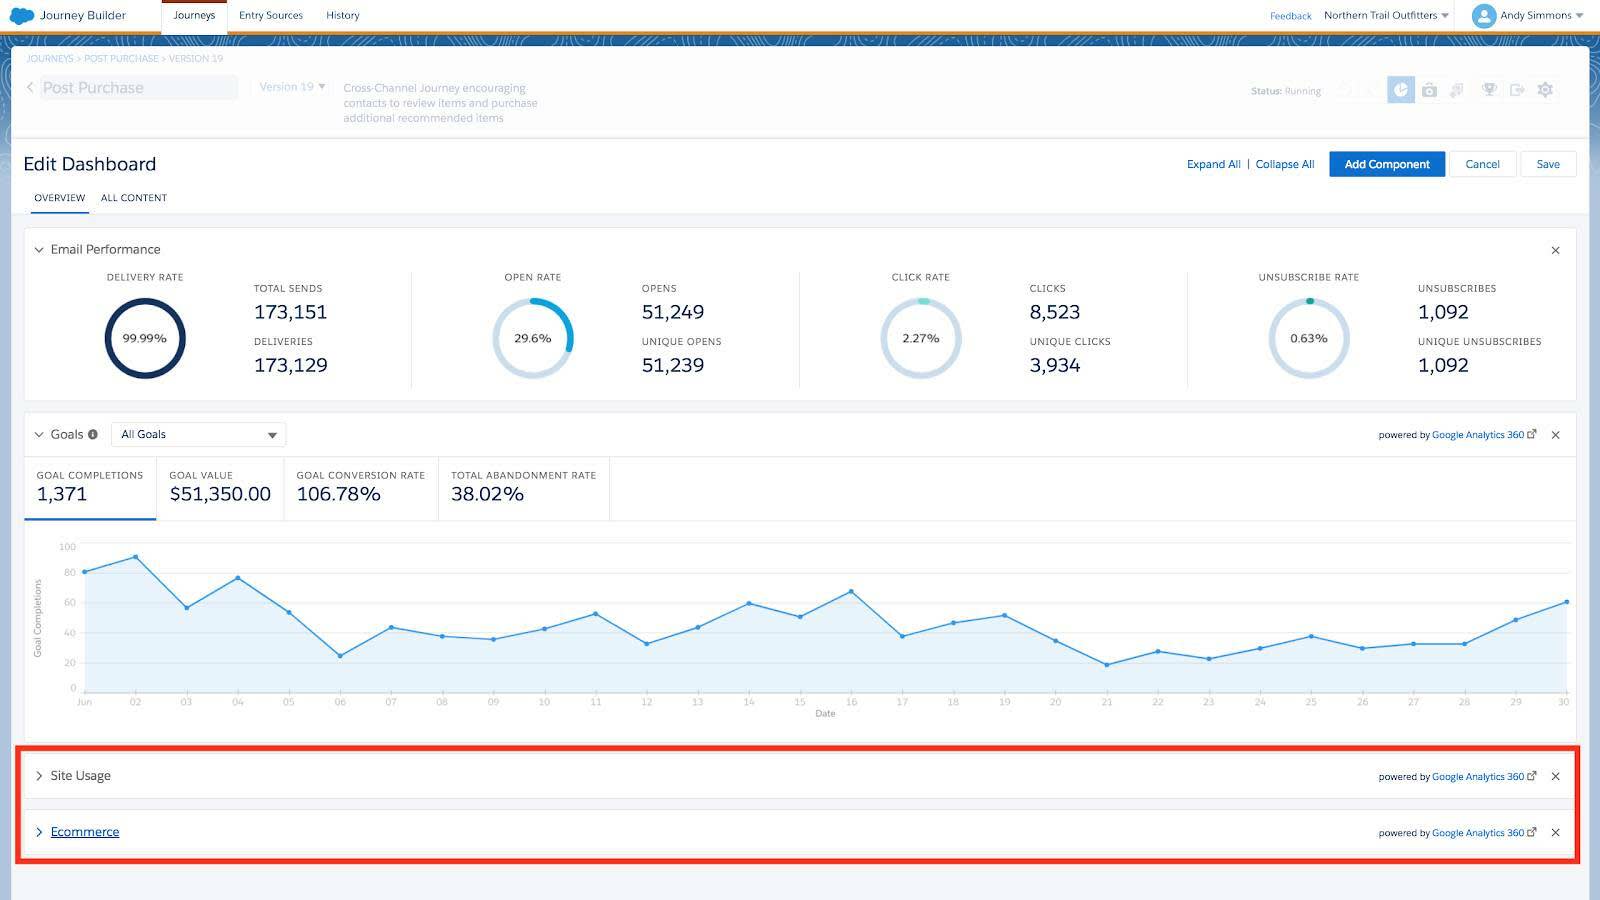
Google Analytics Goal Tile
This tile displays completed activity for the referral traffic on your website generated by Marketing Cloud Engagement messages and journeys so you can gain insight into how Marketing Cloud Engagement referrals contribute to the overall success of your marketing strategy.
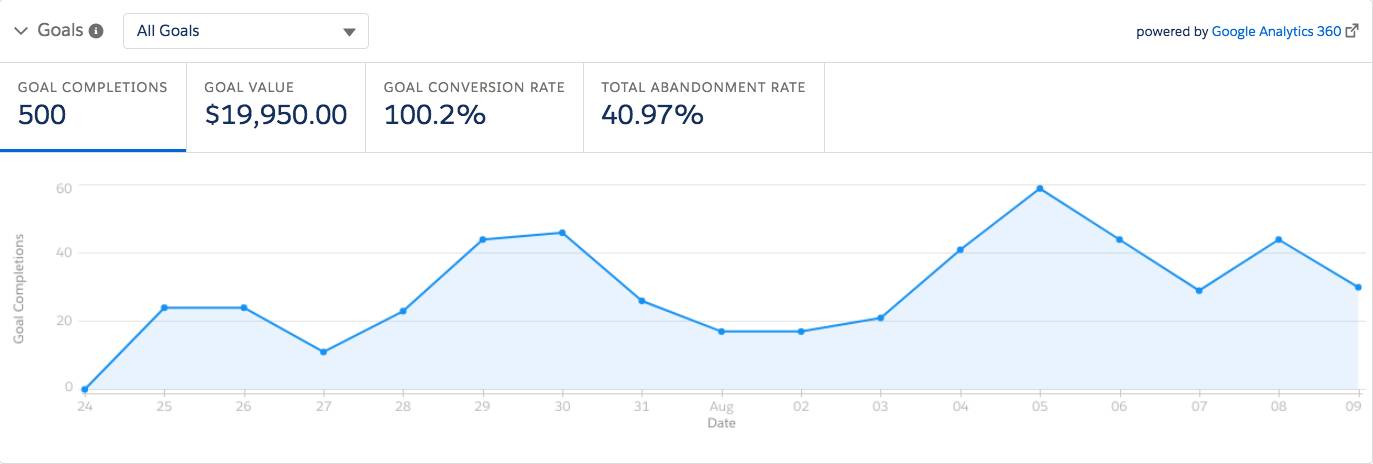
View metrics like:
- Goal completions
- Goal value
- Goal completion rate
- Abandonment rate
What Is a Goal?
Goals measure how well your site or app fulfills your target objectives. A goal represents a completed activity, called a conversion, that contributes to the success of your business.
Examples of Goals
- A purchase on an ecommerce site
- Submitting a contact information form to a marketing or lead generation web page
- Completing a brand or customer satisfaction survey
- Leaving a website review
Email Performance Tile
View essential Marketing Cloud Engagement email performance metrics aggregated for each journey in the Journey Analytics dashboard.
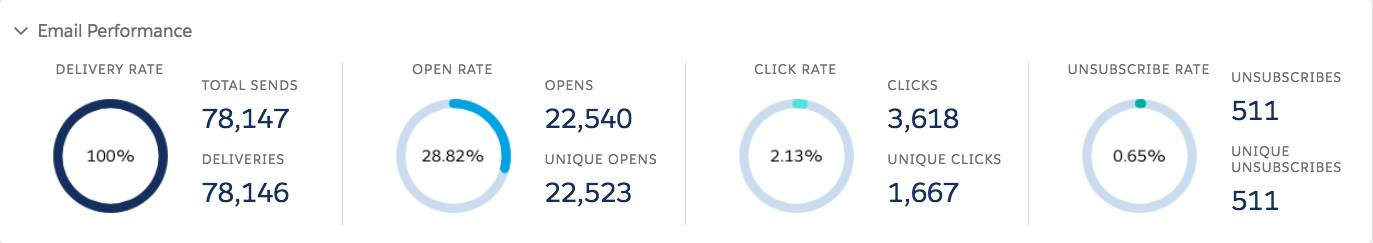
For example, monitor how effective you are at reaching your subscribers’ inboxes with email delivery rate or how your messages are resonating with unique open rate and unique clicks.
Learn more about what email metrics you can view in this article.
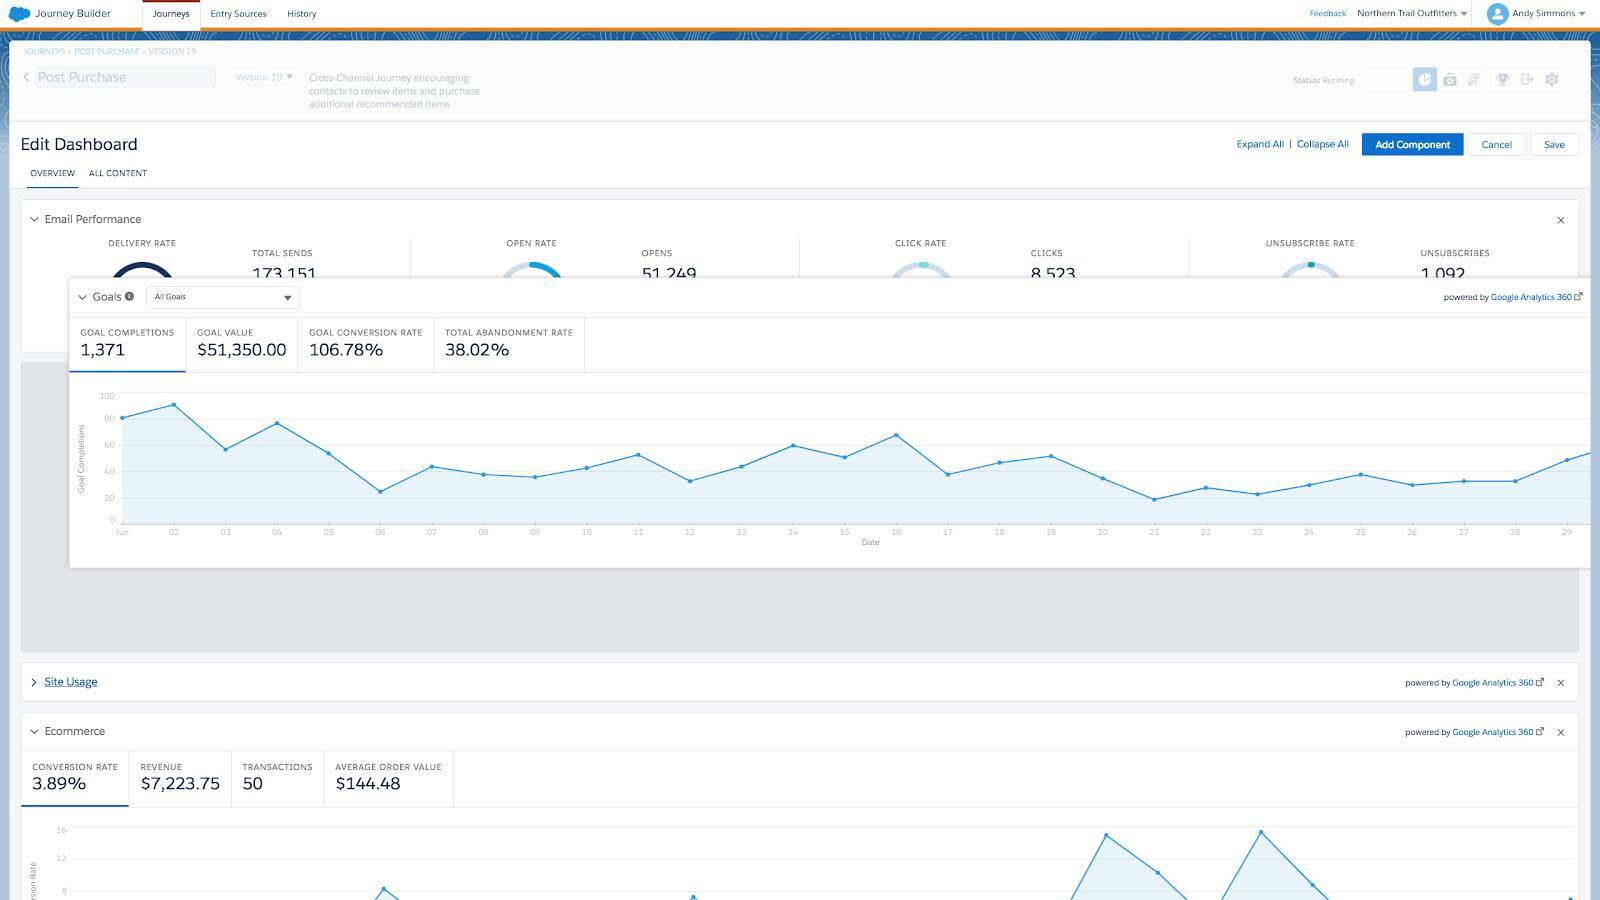
Google Analytics Ecommerce Tile
At some point, you’re going to want to find out whether your emails are resonating with users. Want to know how opens and clicks are translating to conversions and revenue for commerce-oriented brands? Go ahead and click the Ecommerce tile for that.
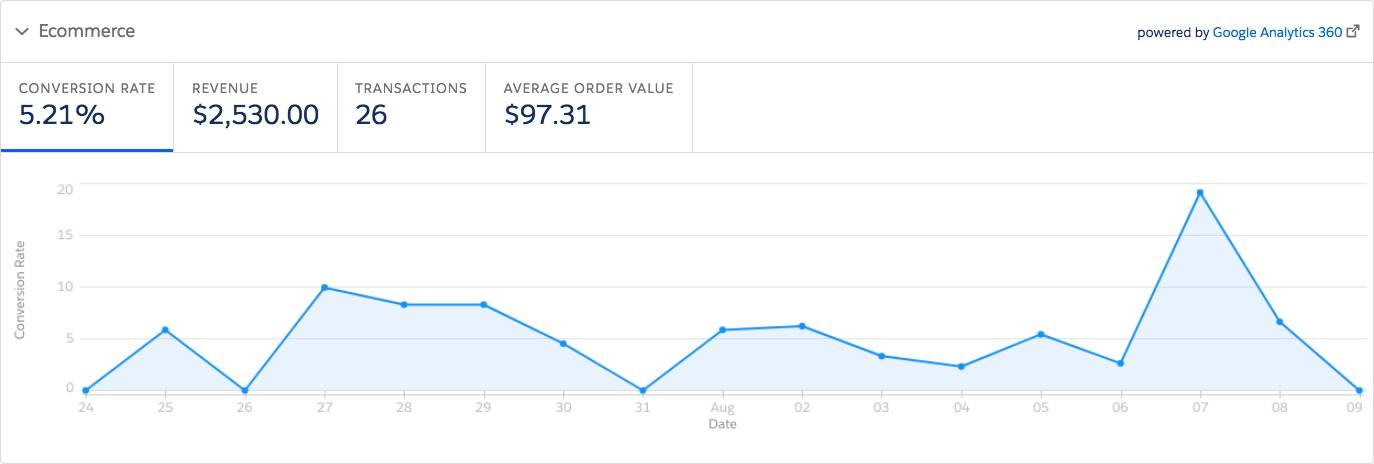
View metrics like:
- Revenue
- Transactions
- Average order value
- Ecommerce conversion rate
Google Analytics Site Usage Tile
So your offer worked! Your user has clicked all the way to the website. Now it’s time to get new insights about how they're engaging your brand on the website. View the Site Usage tile to find out how many email subscribers stuck around and browsed, how many pages they viewed, or even how many subscribers left as soon as they entered the site.
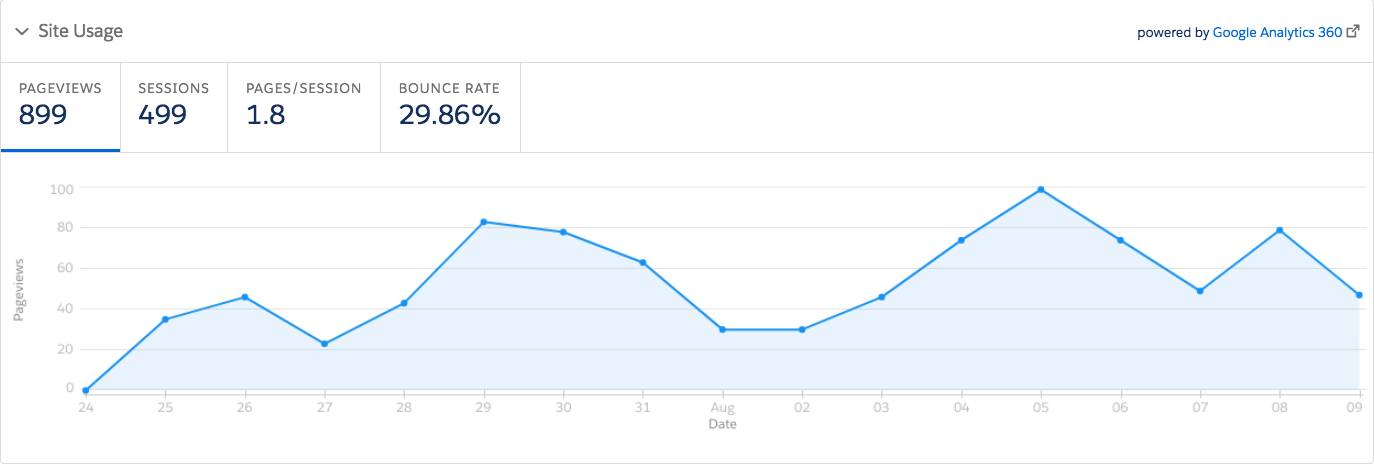
View metrics like:
- Pageviews
- Sessions
- Pages/Session
- Bounce rate
Google Analytics Content Tab
Now it’s time to move beyond vanity metrics, like click-through rates, to get a snapshot of how your content is influencing engagement and buying decisions after the click.
To view metrics, go to the Journey Analytics dashboard, click the Content tab, and view the All Content tile.
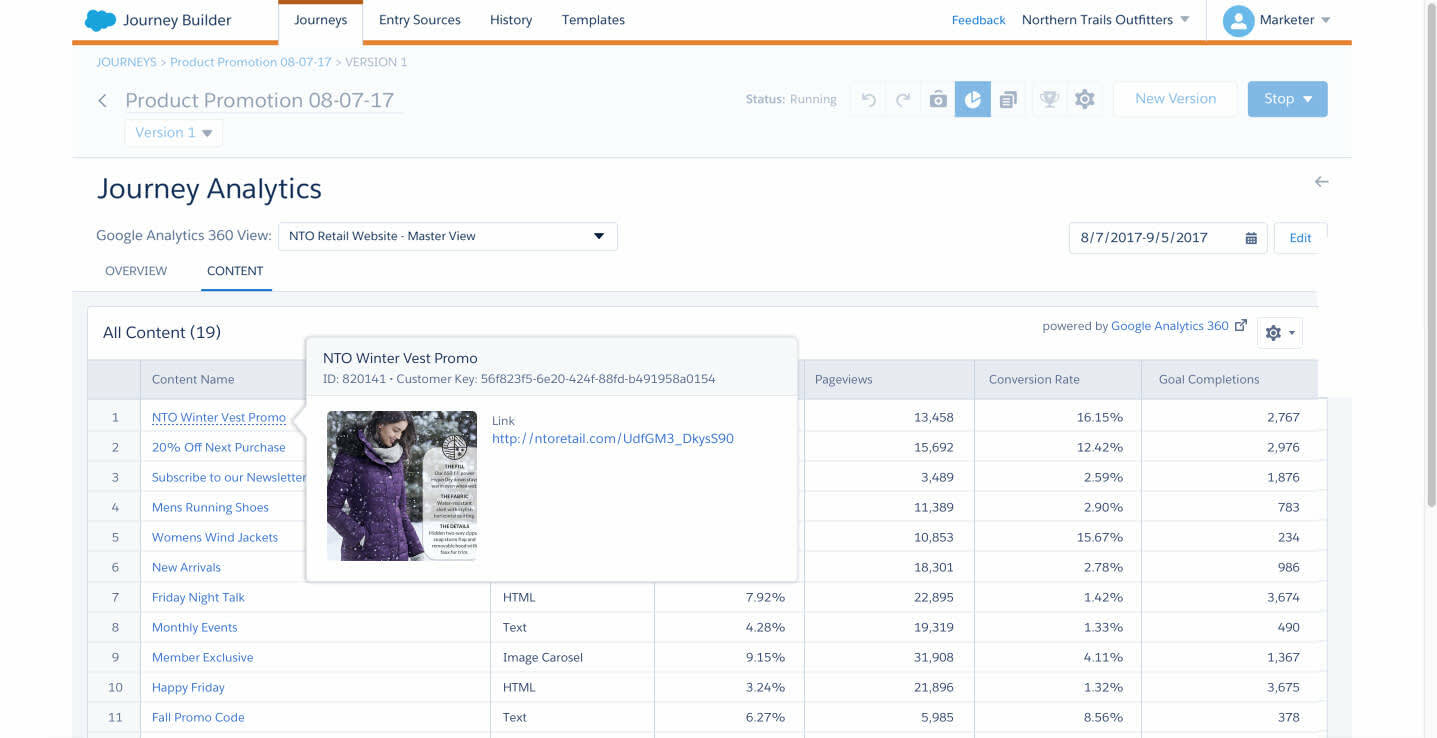
The tile is presented as a table with each row representing an individual piece of content within the journey. (Note: Only those pieces of content that link out to external content are considered.)
View up to 14 metrics to add as columns and customize your reporting view.
- Content Name (Preset Dimension)
- Content Type (Preset Dimension)
- Unique Pageviews
- Goal Conversion Rate
- Goal Completions
- Average Search (Page) Depth
- Average Session Duration
- Abandoned Goal
- Goal Value
- Product Revenue
- Pageviews
- Average Order Value
- Ecommerce Conversion Rate
- Users
Want to explore more about the metrics in the Google Analytics 360 reports? Check out this article.
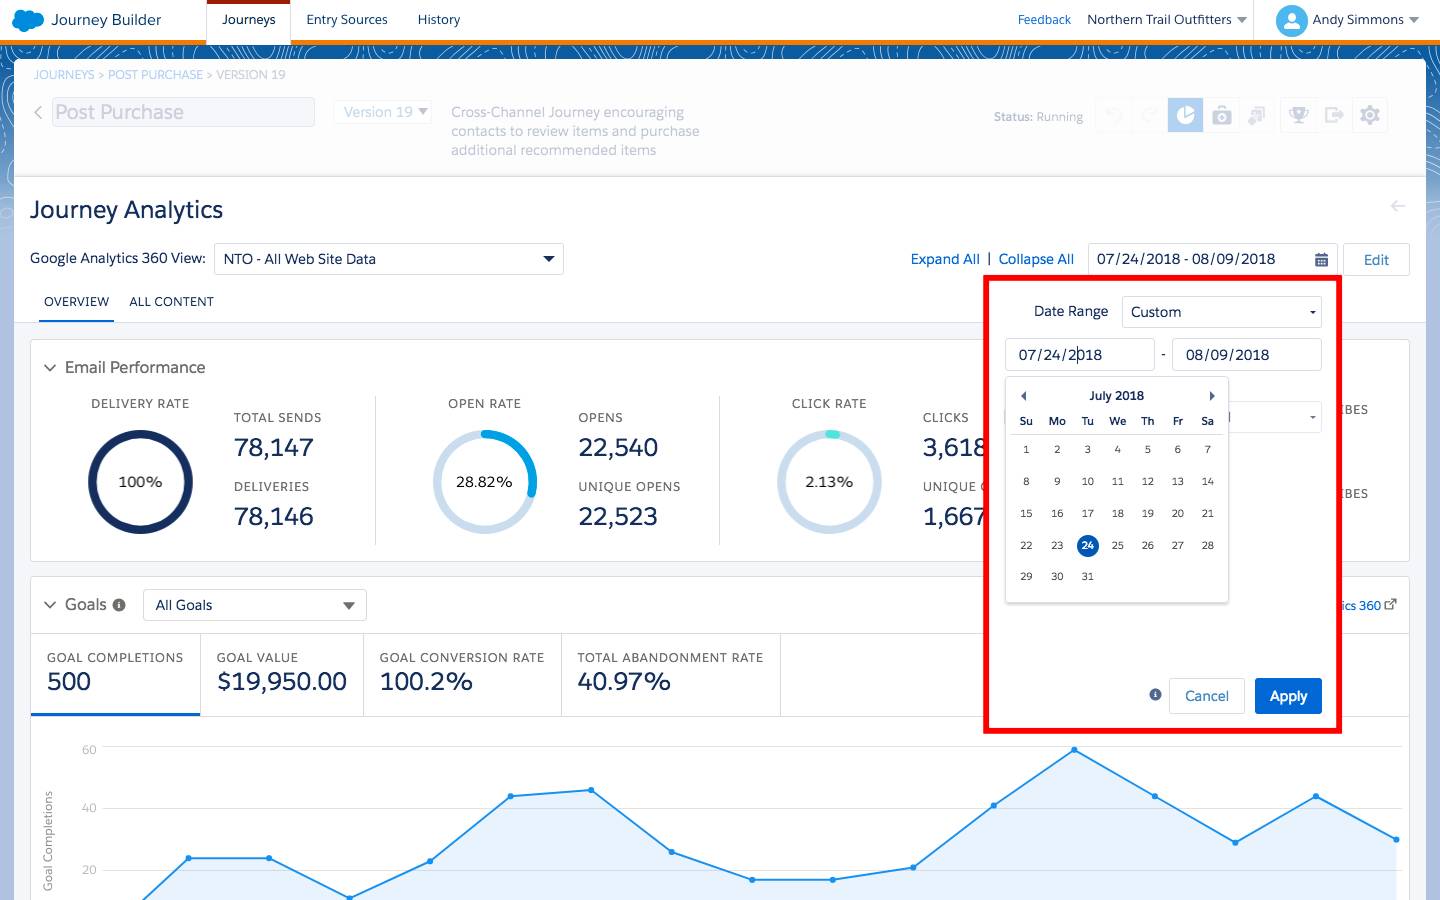
Customize Your Dashboard
Now that you know how to access these reports and views in one place, it’s time to customize the Journey Analytics dashboard to your team’s needs.
Here are some ways you can do that.
Select your date range view: Choose from preset date ranges or set your own custom date range.
Compare data over time: Select between two date ranges to compare marketing performance over time.
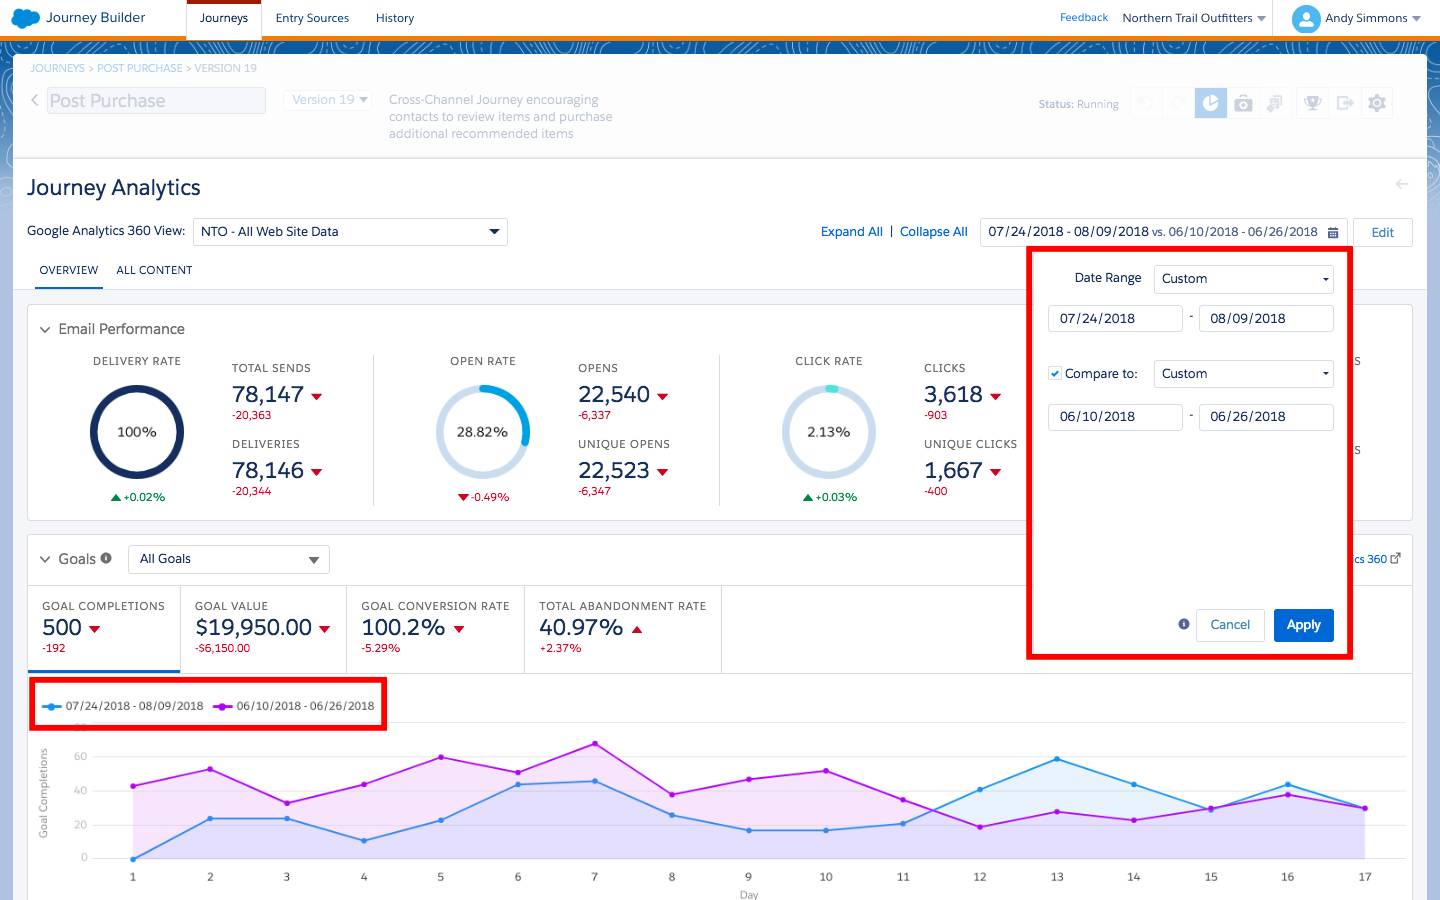
Collapse tiles you don’t need.
And reorder tiles so that the most important reports appear first.
Resources
-
External Site: Google Analytics Support Documentation—About Goals
-
External Site: Google Analytics Support Documentation—About Ecommerce
-
Salesforce Help: Email Performance Tile Metric Definitions
-
External Site: Google Analytics Dimensions & Metrics Explorer
-
External Site: Marketing Cloud Engagement + Google Analytics 360 Announcement Blog Post
-
External Site: Open Colleges Q&A