Gather Intelligence with Apps
Learning Objectives
After completing this unit, you’ll be able to:
- Identify segments to maximize revenue.
- Analyze potential fraud.
- Gather insights for better liability management.
- Explore ways to improve member engagement based on engagement scores.
- Assess the impact of a promotion on the loyalty program.
Identify Segments for Higher Promotion Revenue
Linda creates a new promotion, NTO Surprise and Delight, for Gold-tier members. When members’ purchase value is more than $500 in a quarter, they get 500 bonus points. She adds Gold-tier-related market segments to the promotion so she can narrow down the target audience.
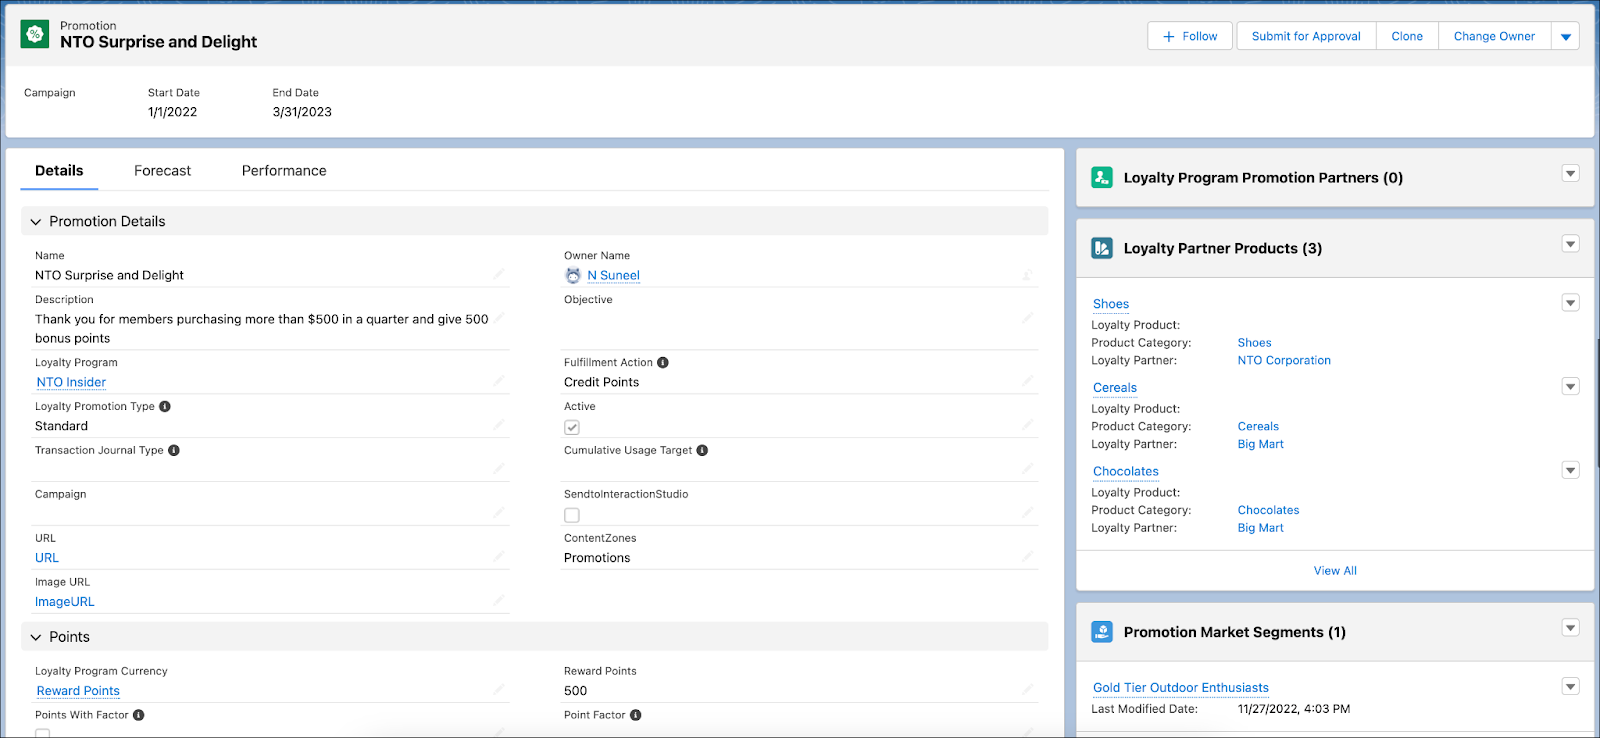
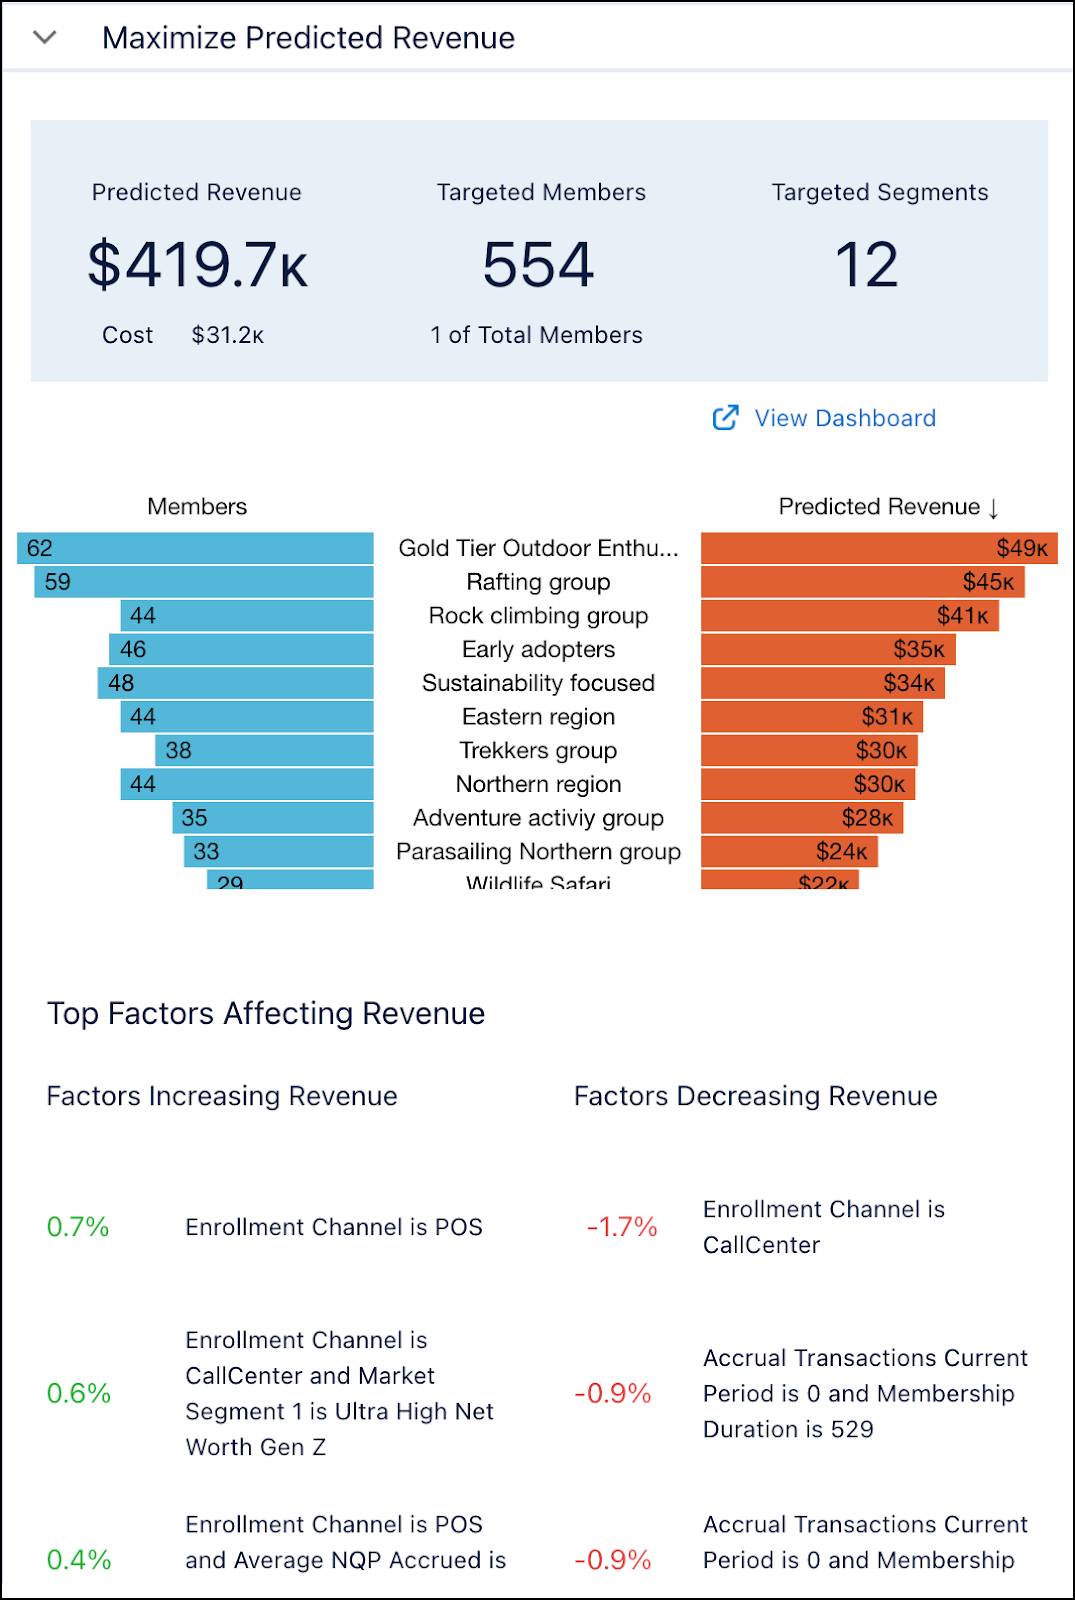
The promotion will improve member engagement and also generate revenue if targeted to the right customer segments. Linda uses the Predictions for Promotion Revenue app to forecast the promotion’s predicted revenue. She can even maximize returns by comparing potential revenue generated by different segments.

Predictions for Promotion Revenue is a Loyalty Einstein Discovery app. It provides predictive and prescriptive analysis to predict future outcomes, and suggests ways to improve predicted outcomes. It includes two dashboards.
- Predicted Revenue for Promotion (Beta)
- Predicted Revenue for Promotion Embedded (Beta)
Linda finds the Predicted Revenue for Promotion Embedded dashboard in the Forecast tab of the NTO Surprise and Delight promotion page.
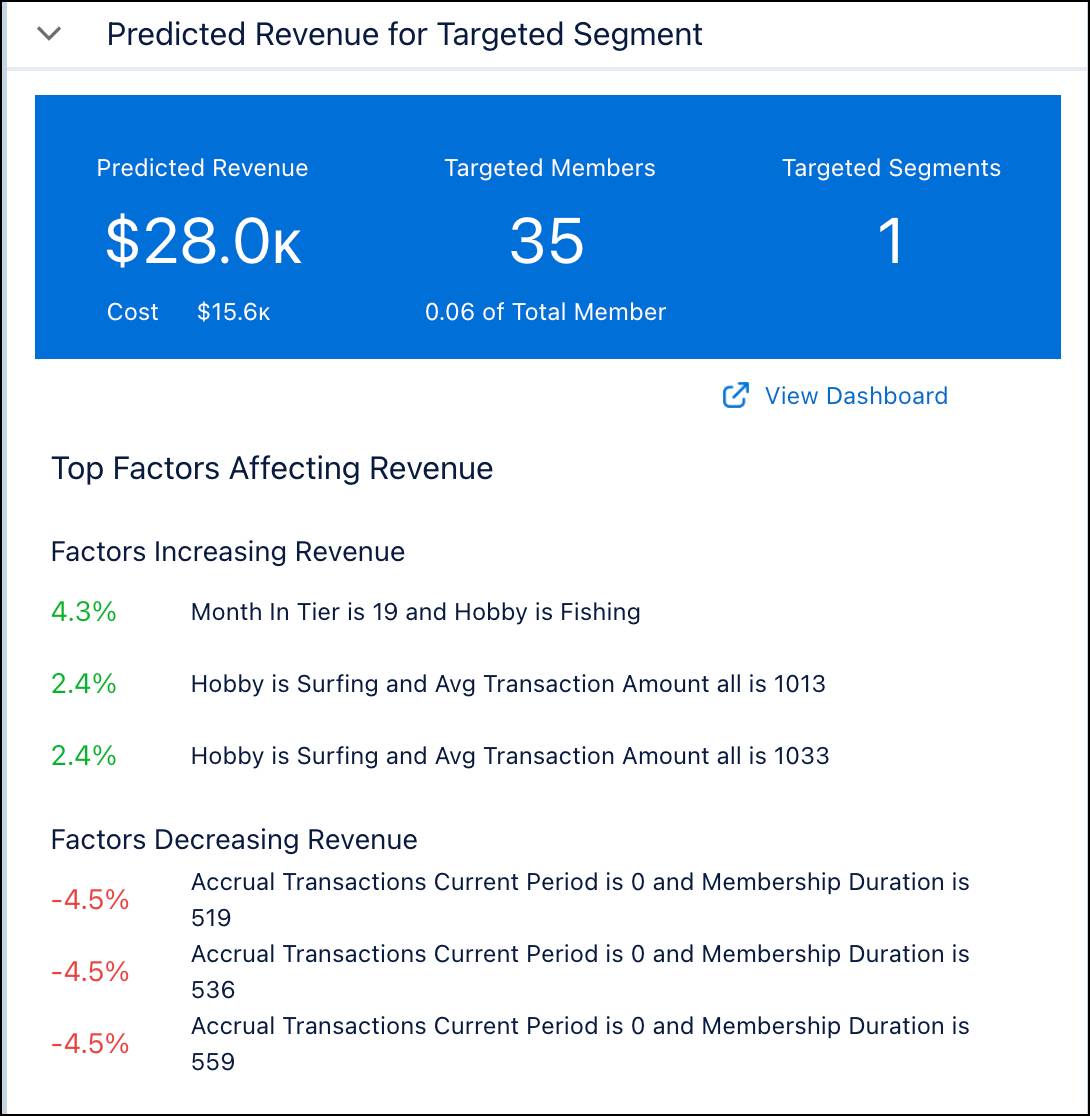
To improve the chances of engagement and revenue, Linda evaluates the potential predicted revenue from other segments.
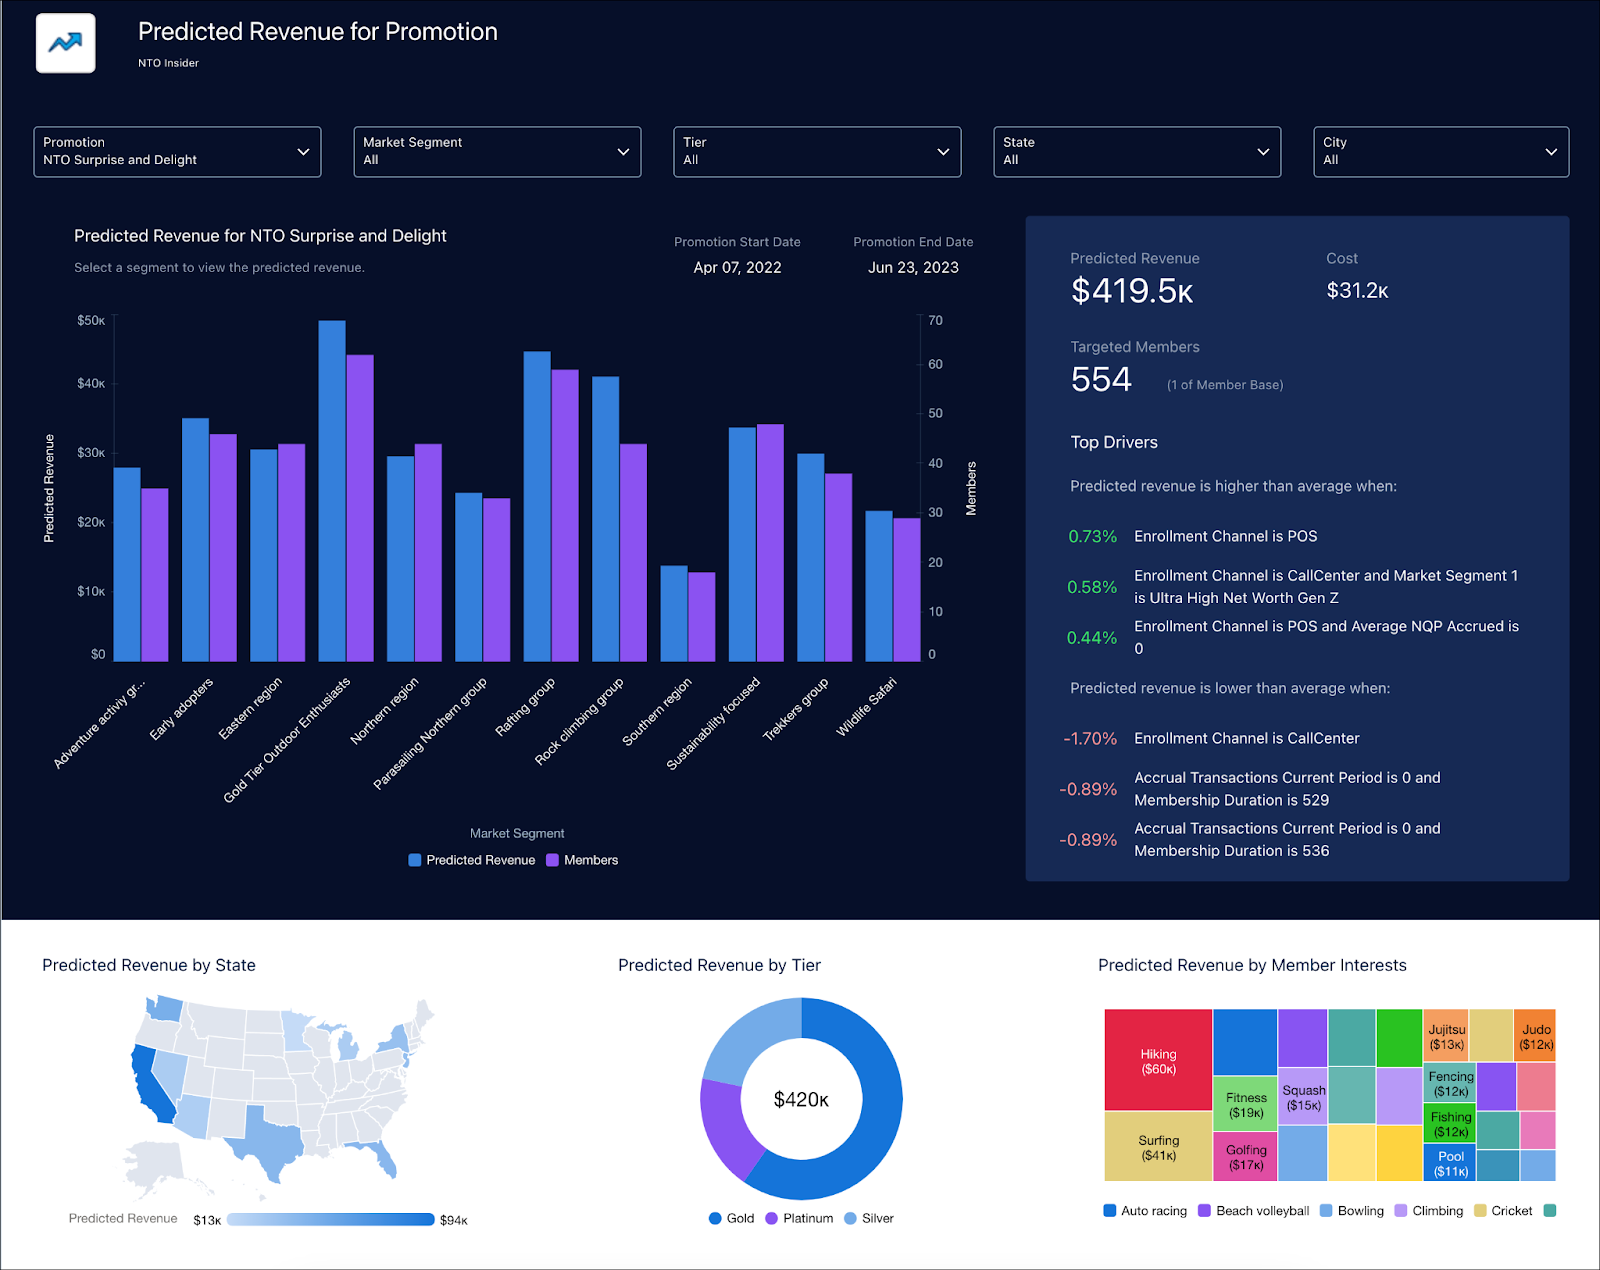
The analytics don’t end here. Linda navigates to the Predicted Revenue for Promotion dashboard to view the predicted revenue by state, tiers, member interests, and so on.
Linda decides to stick to Gold-tier segments and launches the promotion. She’s going over her notes when she receives an email that instantly catches her attention. It says a large number of accrual points have been credited to a member, which indicates potential fraud. She investigates this at once.
Recognize Potential Fraud
The more popularity a loyalty program gains, the higher the risk of fraud. In case of fraudulent activities, it might be an impossible task to identify the cause manually. But thanks to the Fraud Analytics dashboard, Linda can monitor member transactions, points, and service activities to spot fraud.
Linda has already set up an alert for potential fraud. Anytime a member makes more than 50 accrual transactions or accrues over 5,000 points, she receives an email with all the details.
Click Next to see the next image.
Linda opens the Fraud Analytics dashboard and navigates to Accrual Points in the Accruals tab. The member at the top of the leaderboard has 106,000 points. To investigate, she clicks the member name and the dashboard displays details related to their transactions. Linda finds that the transactions are largely related to the Home Health Check product category.

Linda opens the member’s record page in Loyalty Management to check the tier, currencies, and other details. She’s not entirely convinced that the transactions are genuine, so she changes the Member Status field to Under Fraud Investigation.

When a member’s record is flagged, the program manager or the member services manager verifies all related transactions. If they find fraudulent transactions, they reverse or cancel the transactions. In extreme cases, they block the member.
Use Insights to Manage Liability
While a lot of analysis and planning goes into boosting customer engagement, engaged customers also generate liability when they redeem points. With the Liability Forecast dashboard, Linda can analyze the trend for program liability and the factors affecting it, and compare the program liability to the revenue. She can filter the view by the loyalty program, member type such as corporate or individual, tier group, and so on. Based on the filters selected, in the overview section of the Liability Forecast dashboard, Linda sees the count of members, the number of enrollments, revenue, outstanding liability, and details related to non-qualifying points.

At this point, the outstanding liability is less than the revenue so the program is in good health. In the same dashboard, she examines the factors that impact liability, such as vouchers, points, and so on.

Linda sees that there are many accruals, which significantly contribute to liability. To counter this, she plans a redemption promotion to encourage the use of points. She also notes that vouchers are not being redeemed and are getting expired. So she must send periodic emails to members and remind them to use the vouchers before expiry.
Overall, Linda is happy with the liability forecast because it’s as expected. However, member engagement is still on her mind. She wants to create targeted engagement activities, especially for inactive members. Luckily for her, she can use the Predictions for Member Engagement app to strategize and design campaigns.
Maximize Member Engagement
The Predictions for Member Engagement app is a Loyalty Einstein Discovery app that helps strategize and improve member engagement in a loyalty program. It comes with the Member Engagement dashboard, which provides predictions on engagement based on demographics, enrollment channels, transaction KPIs, membership duration, tiers, and location.

NTO Insider members have an average engagement score of 63. The app generates the score based on previous activity or inactivity. For example, if members haven’t had many transactions in the past 6 months, the score is negatively affected. Inactivity can lead to a member’s tier being downgraded, which in turn discourages members from engaging with the program.
Linda wants to increase member engagement in the Gold tier. She creates a filter to display all Gold-tier members with an engagement score less than 50.
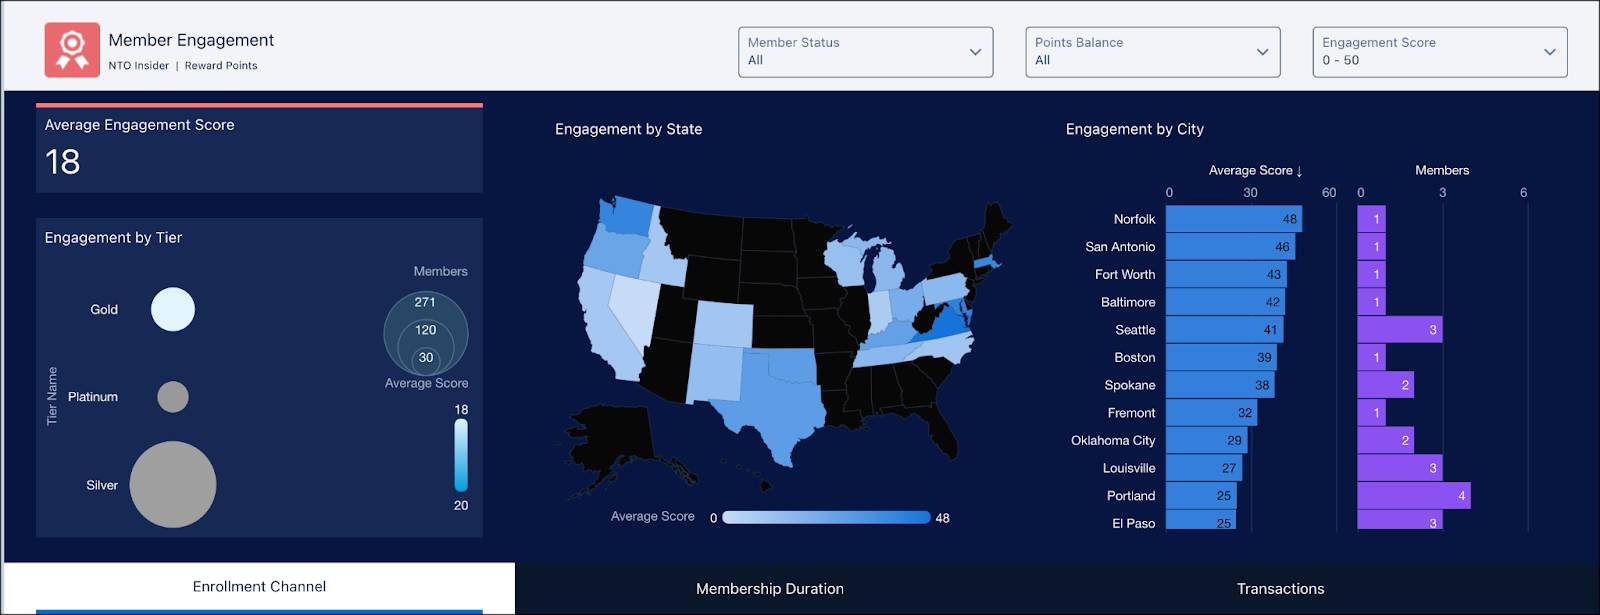
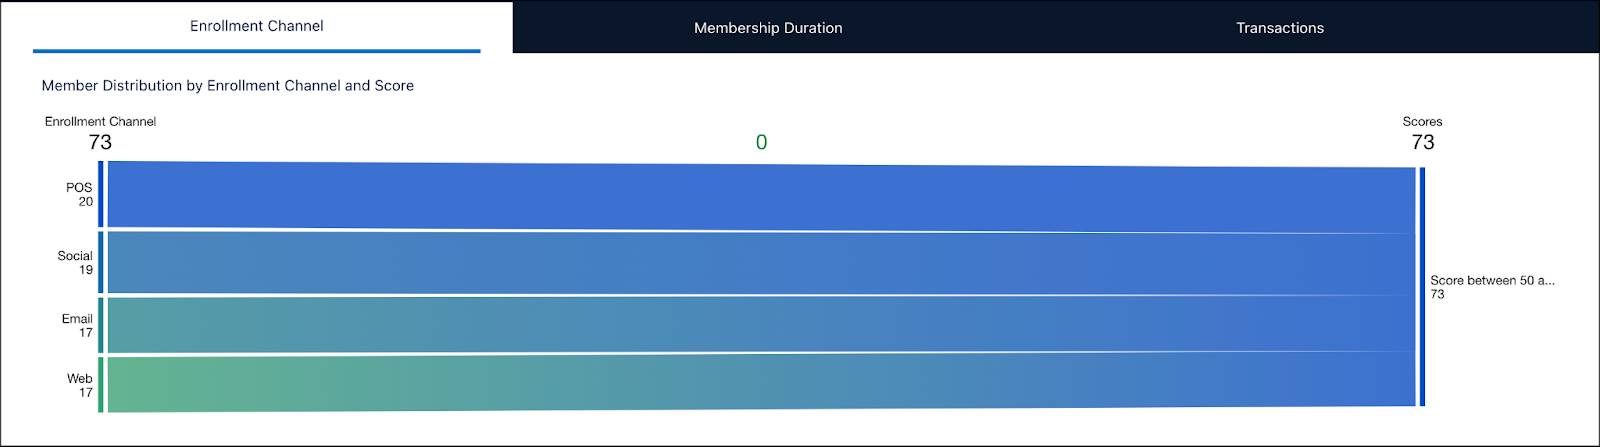
She can see the distribution of these members by region and also analyze how enrollment channels contribute to overall scores.
The Membership Duration indicates how member activities are expected to evolve with tenure. She notes that members who have been in the program for 6–9 months are the most engaged. However, since they’re only a small group, Linda feels it’s best to plan a promotion and campaign for these members to ensure engagement doesn’t drop.

Linda uses the Transactions tab to analyze the score value across different parameters. She wants to understand if there’s a correlation between members’ activity scores and their last transaction.

Based on all that she’s gathered, Linda decides to add these members to a campaign named Gold Tier Reactivate.

She then plans a promotion related to the campaign and sends emails to targeted members. By now, the NTO Insider program has multiple ongoing promotions, and Linda wants to monitor their performance.
Evaluate a Promotion’s Impact on the Program
Linda wants to assess the impact of the NTO Surprise and Delight promotion on the loyalty program. While promotions help improve member engagement, they’re expected to generate revenue and incur liability in the process. Linda uses the Promotion Performance dashboard to analyze how much liability the promotion is accruing.
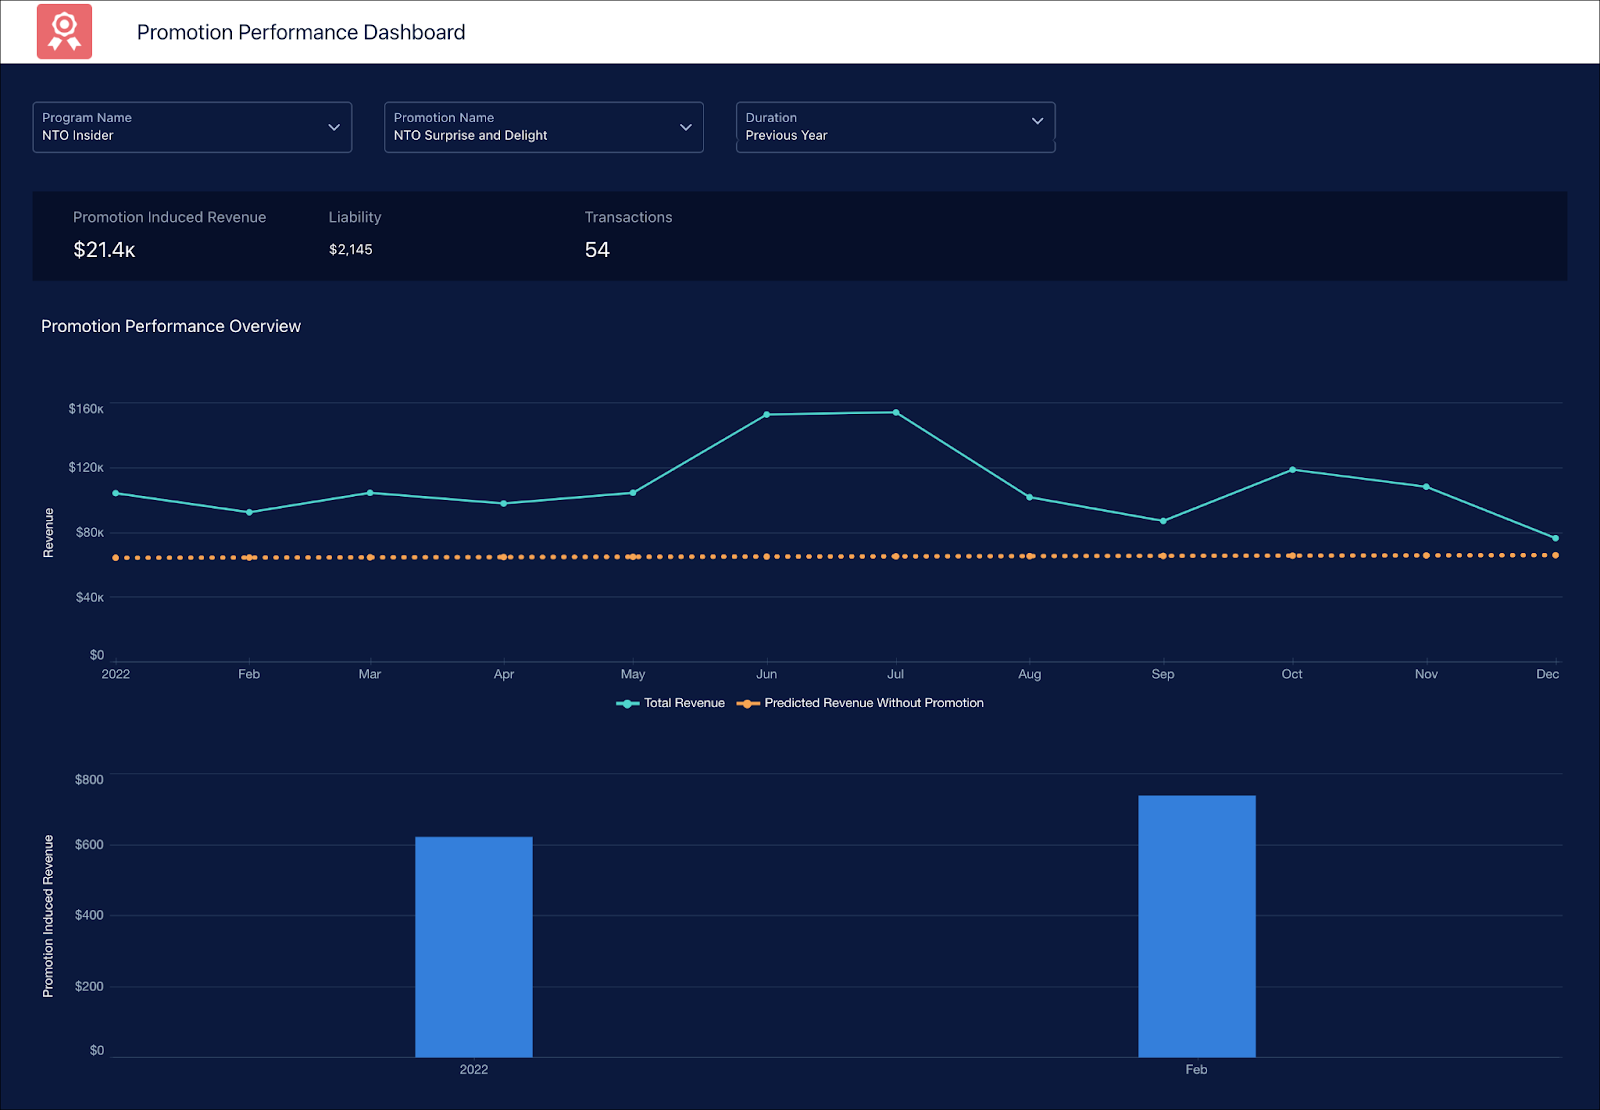
She compares the total revenue generated by the promotion and the predicted revenue without the promotion. She’s glad to note an increase in revenue thanks to the promotion.
Check out this helpful video that summarizes the capabilities of the Promotion Performance dashboard.
Linda wants to sum up all her findings in a report. While she does that, let’s go over and meet Issac and his team. In the next unit, you’ll explore the dashboards that they use.
Resources