Track Your Team’s Targets
Learning Objectives
After completing this unit, you’ll be able to:
- Analyze the Team Targets dashboard.
- Analyze embedded dashboards on record pages.
Study Your Performance
Account manager targets can be based on two types of hierarchy, manager hierarchy and forecast hierarchy. Rayler Parts has opted for manager hierarchy and the CRM Analytics analytics app aligns with this hierarchy when it comes to data security. When creating the analytics app for Bill and his team, Cindy had configured it in a way that the sales target data visible to a user is based on the setup of Team Member Hierarchy in Account Manager Targets. So, Elliott’s dashboard only shows data for his own team, and not data from Bill’s larger team, or from Zac’s team.
Elliot looks at the Team Targets dashboard to understand the performance of each member in his team. He’s looking for answers to the following questions.
- What does the leaderboard for each team look like and who are the best performers?
- Which accounts and products have a higher target compliance, and which have whitespaces for sale opportunities?
Like the My Targets dashboard, the Team Targets dashboard has three primary tabs: Overview, Accounts, and Products. But it also has a summary section that shows key data points.

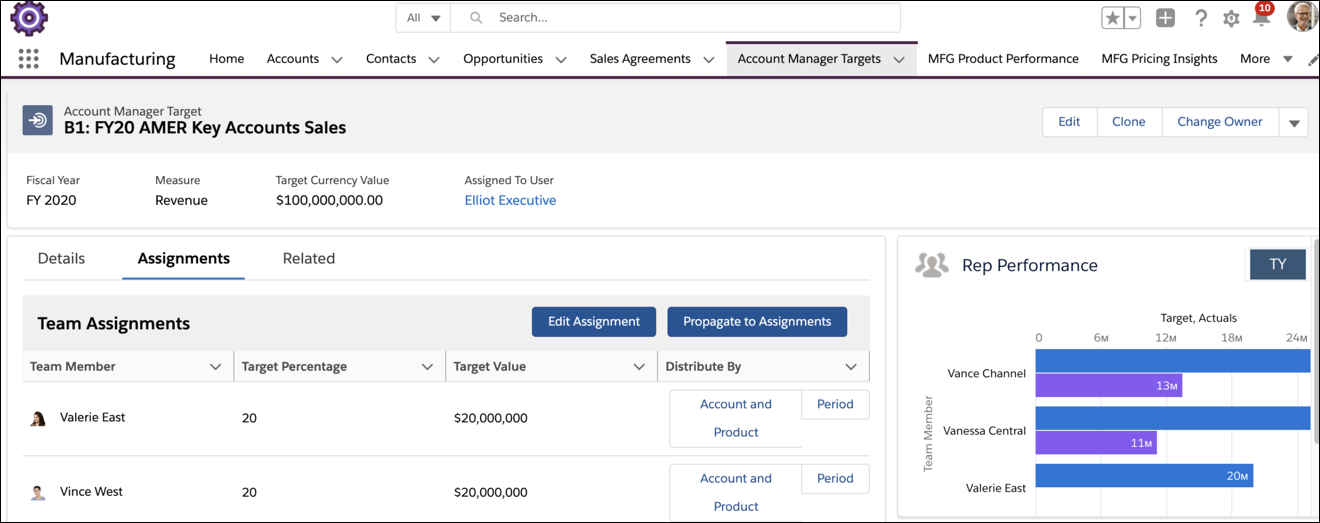
Elliott notes that out of the total $100 million revenue target set for him by Bill, he assigned and distributed $51 million to his team, and kept around $49 million as the target for himself. Therefore, the Assignment Ratio for his team is a little over 51%. Ideally, the assignment rate should be higher than 70% so that Elliott has more time for business strategy. That way, the key account managers in his team would focus on targets and Elliott can spend less time chasing his own targets, and more time helping others improve.
The Leaderboard Says It All
To understand how he can assign the targets better, Elliott needs to see who in his team can manage it better. A leaderboard on the Overview tab shows the ranking of each team member and their performance. Elliott can assess which members have a good balance between the target and actual revenue. He can also look at the projected attainment for each team member for the upcoming months of the year.

While Vance’s actual revenue right now is half of the target revenue, the projected attainment is quite high because there are multiple orders in the pipeline. So Elliott can assign some additional share of the $49 million unassigned target to Vance.
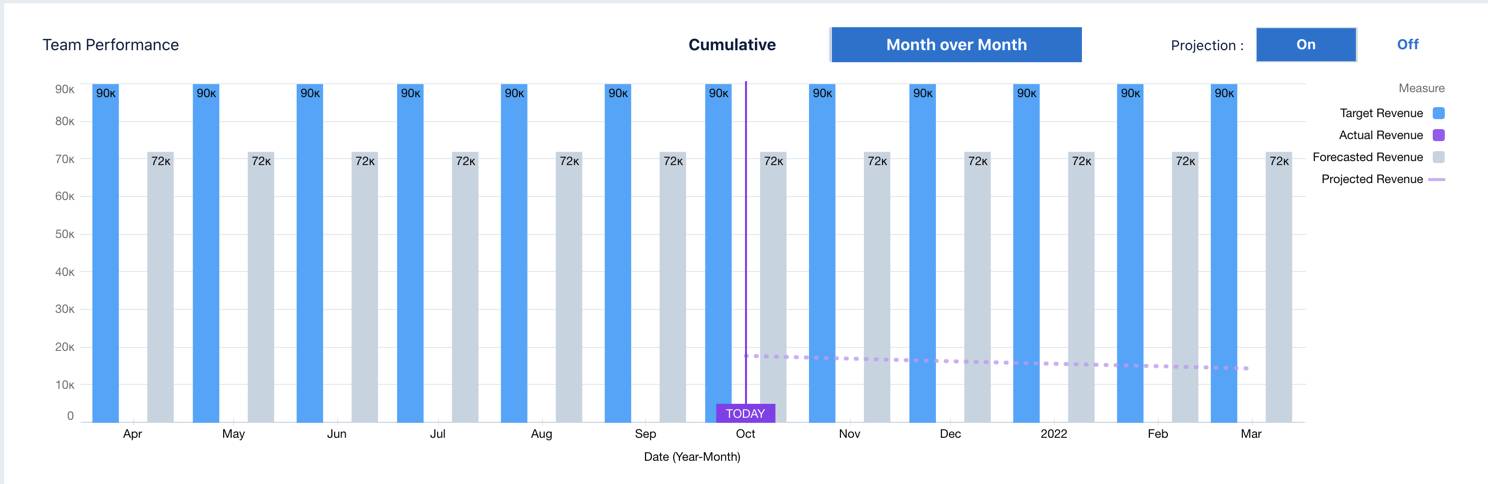
When Elliott clicks on the member tile for anyone in the leaderboard, the data below for team performance shows an individual’s cumulative and month-over-month target versus actual revenue. If forecasts are built in for the accounts, that data is also displayed for comparison.

Elliott switches on Projections to see the level of target attainment projected for the rest of the months, based on historical data and current performance.
Elliott has found out a lot about his team from the Overview tab. And he knows how to assign the unassigned share of targets. But he still wants to understand what’s contributing to the varied levels of target attainment, in terms of products and accounts. Maybe there are specific account-product combinations that are doing the trick for some members? Let’s find out more.
Find Out What to Sell and Where
Elliott turns to the Accounts tab of the Team Targets dashboard. He can toggle between the target year and the previous year’s data. This dashboard only shows the account performance for everything that’s within Elliott’s territory of AMER. He can see that for Acme Corp, the target and actual revenue are on par! For Global Enterprises, while the actuals don’t look promising, the projected revenue is high.

Next, Elliott finds a heat map that shows the performance of team members and accounts with a meter to indicate the level of revenue or attainment. For Vance and Acme, the heat is on! The darker the color of the heat map, the greater is the revenue for an account for a member.

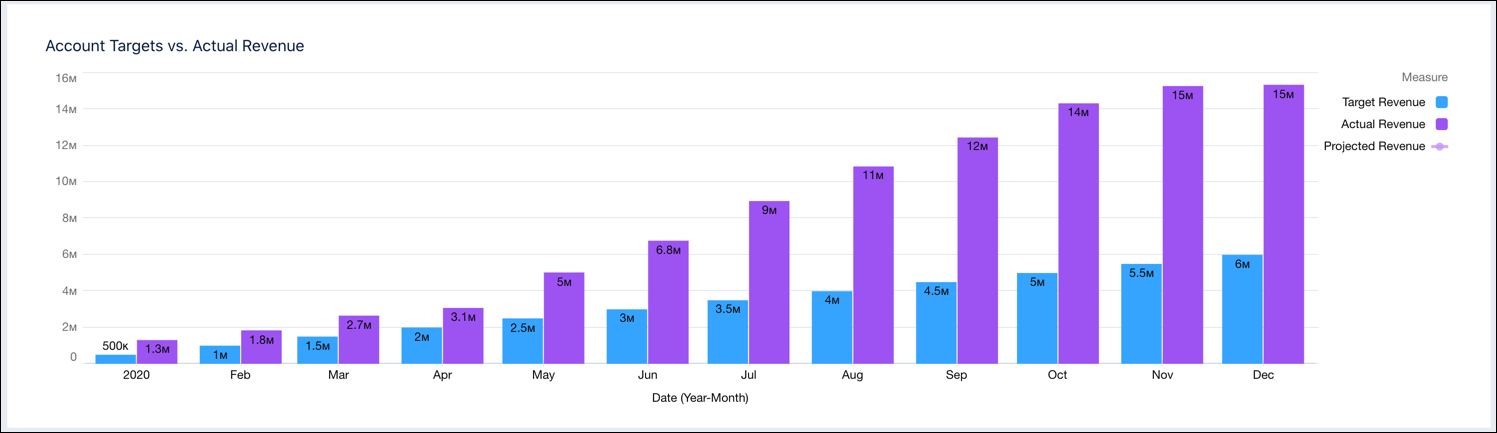
Elliott goes to the Actual Targets vs. Actual Revenue dashboard and notes that the last few months of the year have been particularly good for Vance.
Elliott must now look at products. What products can they offer to accounts that are contributing least to the revenue share? To increase the actual revenue for some members, it’s important to see which products are doing well. Based on the whitespaces, team members can attempt to sell the better-performing products to their clients and partners. If clients and partners order some of those products, the actual revenue by the end of the year would be a lot closer to the targets.
On the Products tab of the Team Targets dashboard, Elliot finds that products like Pulverizer P20 are doing better than others. And for the Ripper 19 product, the actual revenue and projected attainment is higher than the target. Must be selling like hot cakes then! This is something the team members must look into.

Elliott checks the product heat map and finds that Vance is responsible for the high sale of products like Pulverizer P20.

Similar to the Accounts tab, the Product tab has a view where Elliott can check how the team members are doing in terms of their targets and actuals. Elliott goes to the dashboard for Vance, and finds that product sales have significantly increased over the year. A great performance overall by Vance!

It’s All Deeply Embedded
Apart from the CRM Analytics dashboards available within the Analytics app, Manufacturing Cloud has two embedded dashboards that offer deep, in-context analysis of sales targets. Here are the dashboards and the key business questions they help you answer.
- Target Attainment
- What’s my target attainment?
- What’s the projected attainment?
- Team Performance
- How are my team members performing against revenue targets?
- How did my team perform last year?
Cindy has already embedded both the dashboards on Account Manager Target record pages. To analyze the dashboards, Elliott opens his target record for sales and revenue for FY20 where he had distributed and split the target across his team members.
Better Insights, Better Results
Elliott has gathered a wealth of insights and is ready to discuss them with Bill and account managers. With embedded insights and extensive dashboards, account managers can remain on top of their targets, and sales managers can analyze team performance to identify areas of improvement. Rayler Parts is using the dashboards effectively and so can you!