Learning Objectives
After completing this unit, you’ll be able to:
- Determine when and how to build a layered map.
- Add visual detail to a layered map.
You can use Mark layers to add multiple layers of geographic data to a map. Mark layers act like transparent overlays, and each layer can have its own mark type, color palette, and caption.

When to Build a Layered Map
Build a layered map when you have more than one set of geographic data that you'd like to analyze in relation to one another. For example, you learned in a previous unit that EV charging stations tend to follow the major interstates in Washington State. You can find out if the density of charging stations also increases with the concentration of EV owners by creating these two maps as layers and overlaying them on top of each other.
Basic Layered Map Building Blocks
Location |
Data |
|---|---|
Geographic Data |
Two or more fields with a geographic role assigned. At least one per geographic layer. |
Detail |
One or more measure fields per geographic layer. |
Mark type |
Can be different for each layer. For example, Density and Shape, or Map and Automatic. |
How to Build a Layered Map
Connect Your Tableau Public Account
If you haven’t already, or if your Tableau session has expired, log in to your Tableau Public account in the Playground window to the right. If you don’t already have a Tableau Public account, sign up for one now, and be sure to activate your account before starting this interactive unit. You can find more detailed instructions here.
Build Your First Map Layer
- From the data pane, under the Alternate Fuel Stations table, drag ZIP to the canvas.
- From the data pane, drag EV DC Fast Chargers onto Color on the Marks card.
- On the Marks card dropdown, select the Density mark type.
- Expand the dropdown on the EV DC Fast Count pill, select Measure, and make sure that Sum is checked.
Build Your Second Map Layer
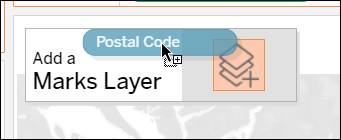
- From the data pane, under the EV Registrations table, drag Postal Code to the top left of the canvas, just below the title.
- Drop the field onto the Add a Marks Layer box that appears on the top of the canvas.
You now have two Marks cards, one on top of the other.
- Drag the DOL Vehicle ID measure field onto Size on the EV Title and Registration Marks card.
- Expand the dropdown on the DOL Vehicle ID pill, select Measure, and choose Count (Distinct).
Congratulations! You’ve created a layered map.
Add Visual Detail to a Layered Map
When you have more than one layer on a map, it’s important that the marks are distinctive from one another. You can do this by using shapes, colors, and different map types to set the layers apart.
For your base map, shown on the Marks card as Alternate Fuel Station, change the map to a density map.
- Set the mark type to Density.
- Change the color palette to Density Multi-color Dark.
- Increase the color intensity to 85%.
For your second layer, shown on the Marks card as EV Registrations, format the marks to visually separate the overlapping marks.
- Change the size of the marks to 40%.
- Change the color to red.
- Add a black border to the marks. This will visually separate the overlapping marks.
- Choose a different background style. For this exercise, choose Outdoors.
Your layers are easier to distinguish, and you're ready to analyze your map.
Analyze a Layered Map
With a layered map, a new control icon appears with the search toolbar: The Control Map Layers icon  .
.
This icon, which also appears when you hover over the map, brings up the Layer control box, which lets you control map layers. You can lock each layer, or uncheck the different layers to show more or fewer layers at any given time. If you deselect a layer, you can easily add it back without having to rebuild your viz.
What do you see when analyzing this map? The concentration of EV chargers is higher in postal codes with a lot of registered EVs, but there are also hubs of chargers along the interstate where EV registrations are low.
In this unit, you learned how to build a layered map and how to differentiate map layers from each other. You've learned when and how to answer spatial questions with Maps in Tableau, and you’ve learned a few of the many ways to build, format, and analyze maps in Tableau. The world is now at your fingertips.