Set Up CRM Analytics to Predict Volume
Learning Objectives
After completing this unit, you’ll be able to:
- Describe Trade Promotion Optimization (TPO) prediction models.
- Explain why clustering data is important for prediction volume.
- Explain the steps for creating an app to forecast baseline sales volume.
- Summarize the steps for creating an app to forecast uplift sales volume.
- Predict uplift sales volume.
Training Prediction Models
So far, you’ve learned the importance of defining KPIs, configuring templates, and connecting the necessary data that powers the forecasting processes. In this unit, you dive into setting up your very own CRMA forecasting apps.
After transferring your promotion data to CRMA, create meaningful clusters of sales data to train TPO prediction models. In general, clustering sales data, including accounts and product categories, help you to segment customers and stores based on purchase behavior, enabling targeted marketing and improved resource allocation. This way, you can group similar customers and locations so that your businesses can optimize pricing, promotions, and product assortments.
TPO is a powerful Agentforce Consumer Goods feature that helps you to optimize and analyze your trade promotion strategies. By training the TPO prediction models, you provide the informational backbone for your baseline and uplift volume forecasting.
The first step in training the models is using Scoring Framework to configure the CRMA app so that you can cluster accounts and product categories and improve the accuracy of your baseline sales forecasting. This process involves grouping products with similar sales volumes and variances. By segmenting data in this way, you can ensure stable forecasts and eliminate the need to manually select accounts and products when you install the TPO Baseline App later in the process.
For the clustering process, the machine learning model requires external data. Before you begin, create a CSV file of your external data set and the TPO Calendar data to use in your configuration. To learn more about creating this CSV file and the input and output fields, see the Before You Begin Help article.
Clustering Accounts and Product Categories
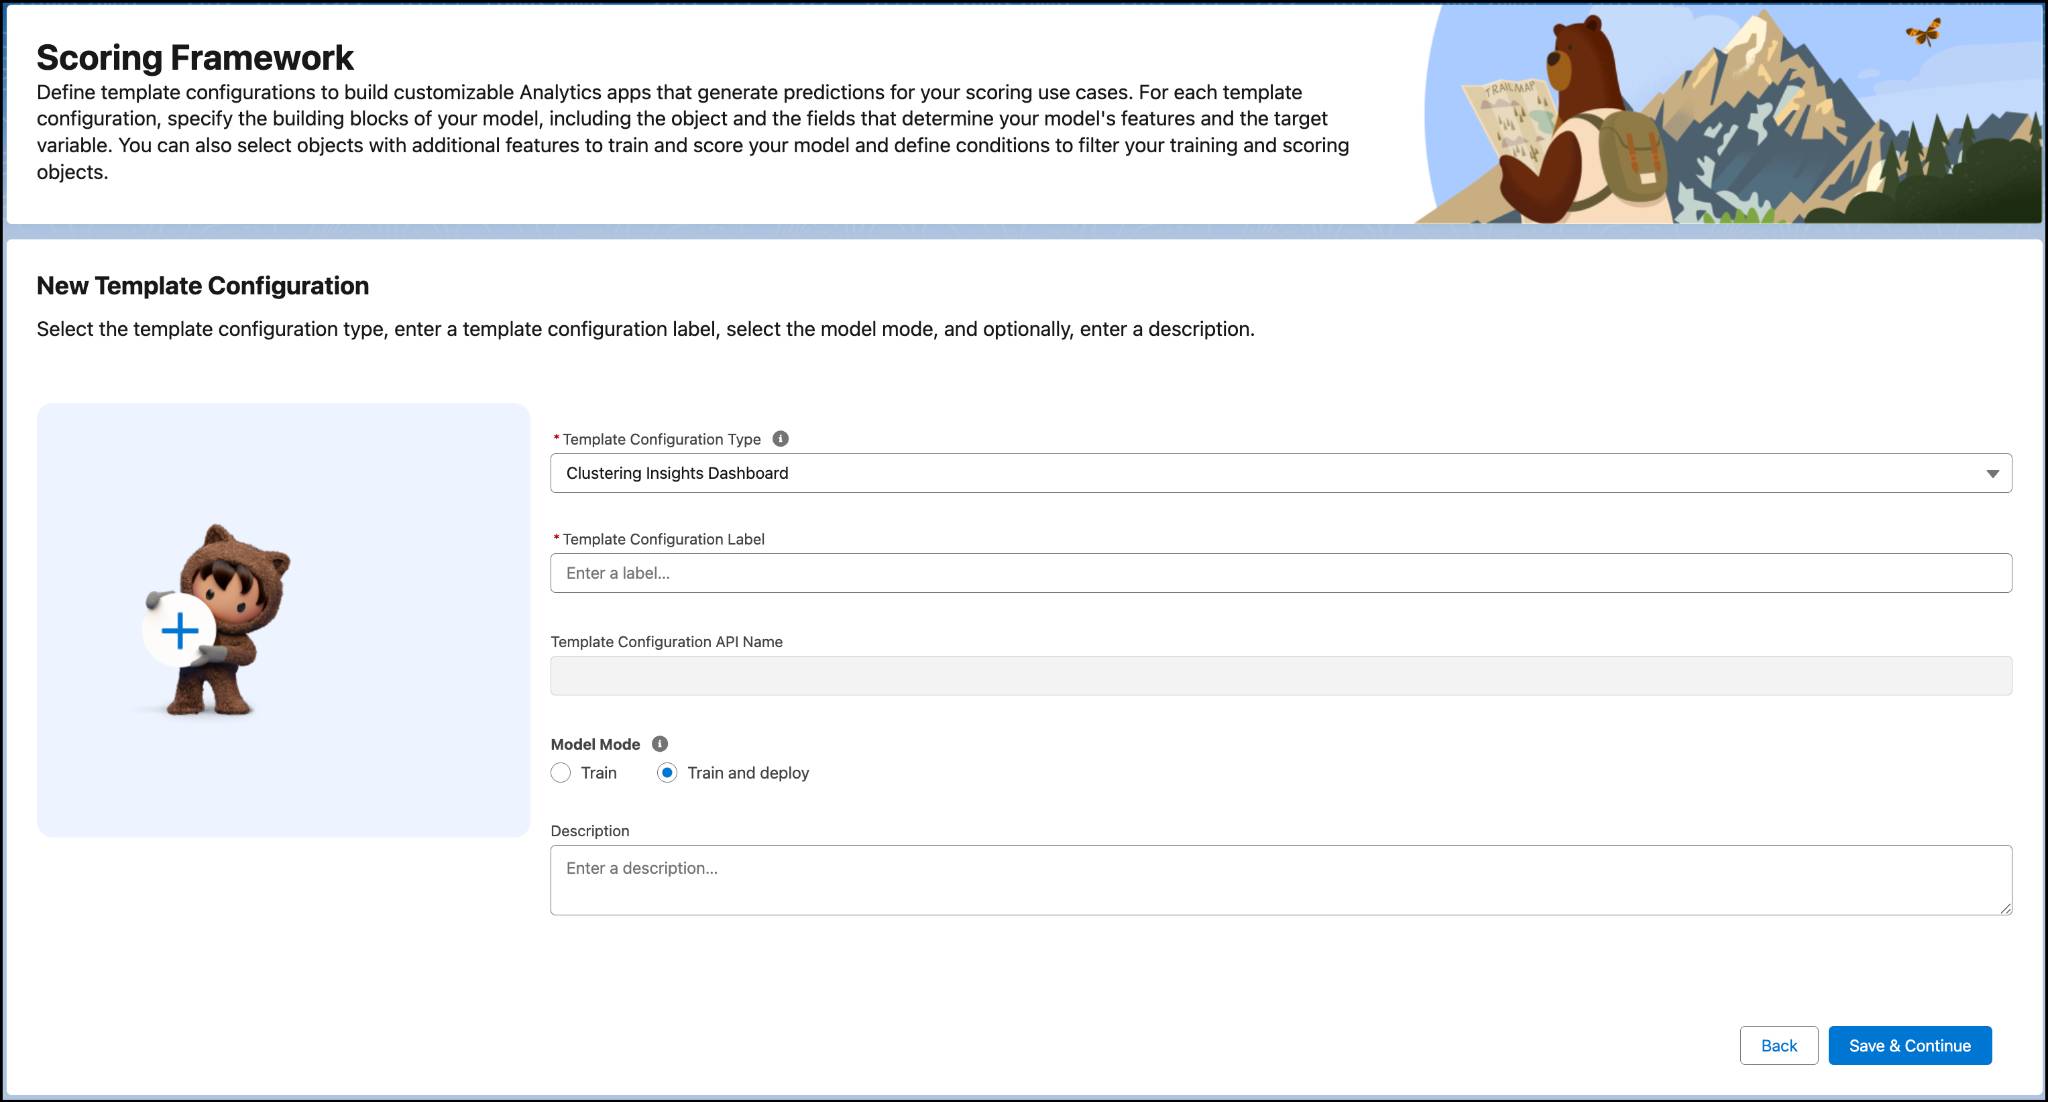
To cluster the accounts and product categories, first define a CRM Analytics template configuration using Scoring Framework, which helps you to create customizable analytics apps. This template configuration generates the predictions for scoring and helps segment sales data based on historical patterns.
For example, Fatima uses Scoring Framework to create a template configuration, and sets the Clustering Insights Dashboard as the template configuration type.
Use templates to quickly create CRM Analytics apps and get started on your analytics journey. These apps include customizable ready-made dashboards and KPIs.
The Analytics app you create contains preconfigured recipes that generate various datasets, and a dashboard that you can use to view clusters of accounts and products.
A recipe named Clustering_Category_Full_Recipe fetches the data from enterprise resource planning (ERP) systems through integration with Salesforce Standard Objects. This recipe groups together accounts and product categories into clusters, and produces the final dataset.
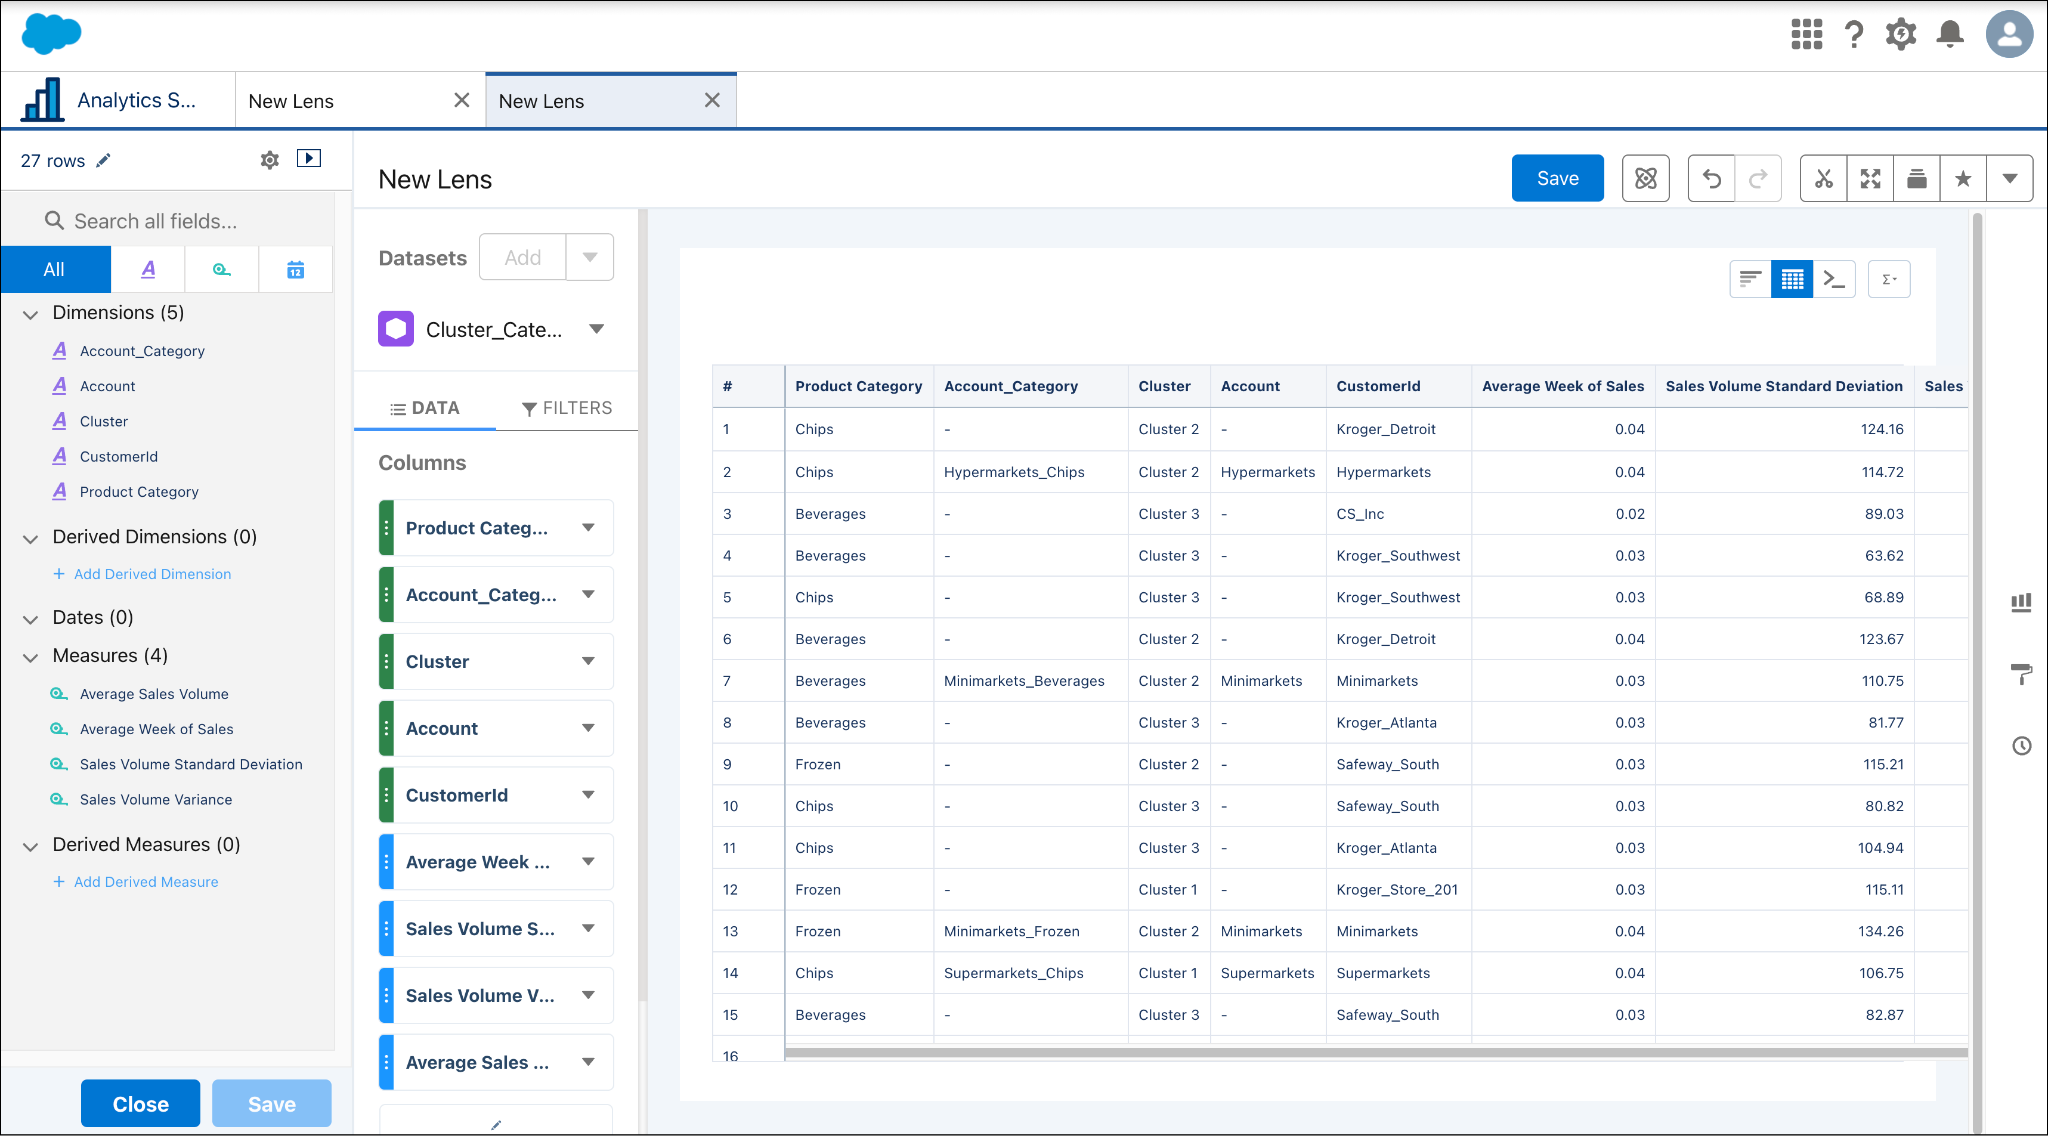
Accounts and product category clusters help you to measure product performance in the market. For NTO, admin Fatima clusters product categories such as chips and beverages, because they have higher sales in the hypermarkets. She creates another cluster for frozen goods and beverages because they’re a low-selling category in minimarkets.
The Account Cluster Insights dashboard helps you analyze the performance of each product group based on sales volume metrics so you can evaluate how volume and metrics affect overall sales.
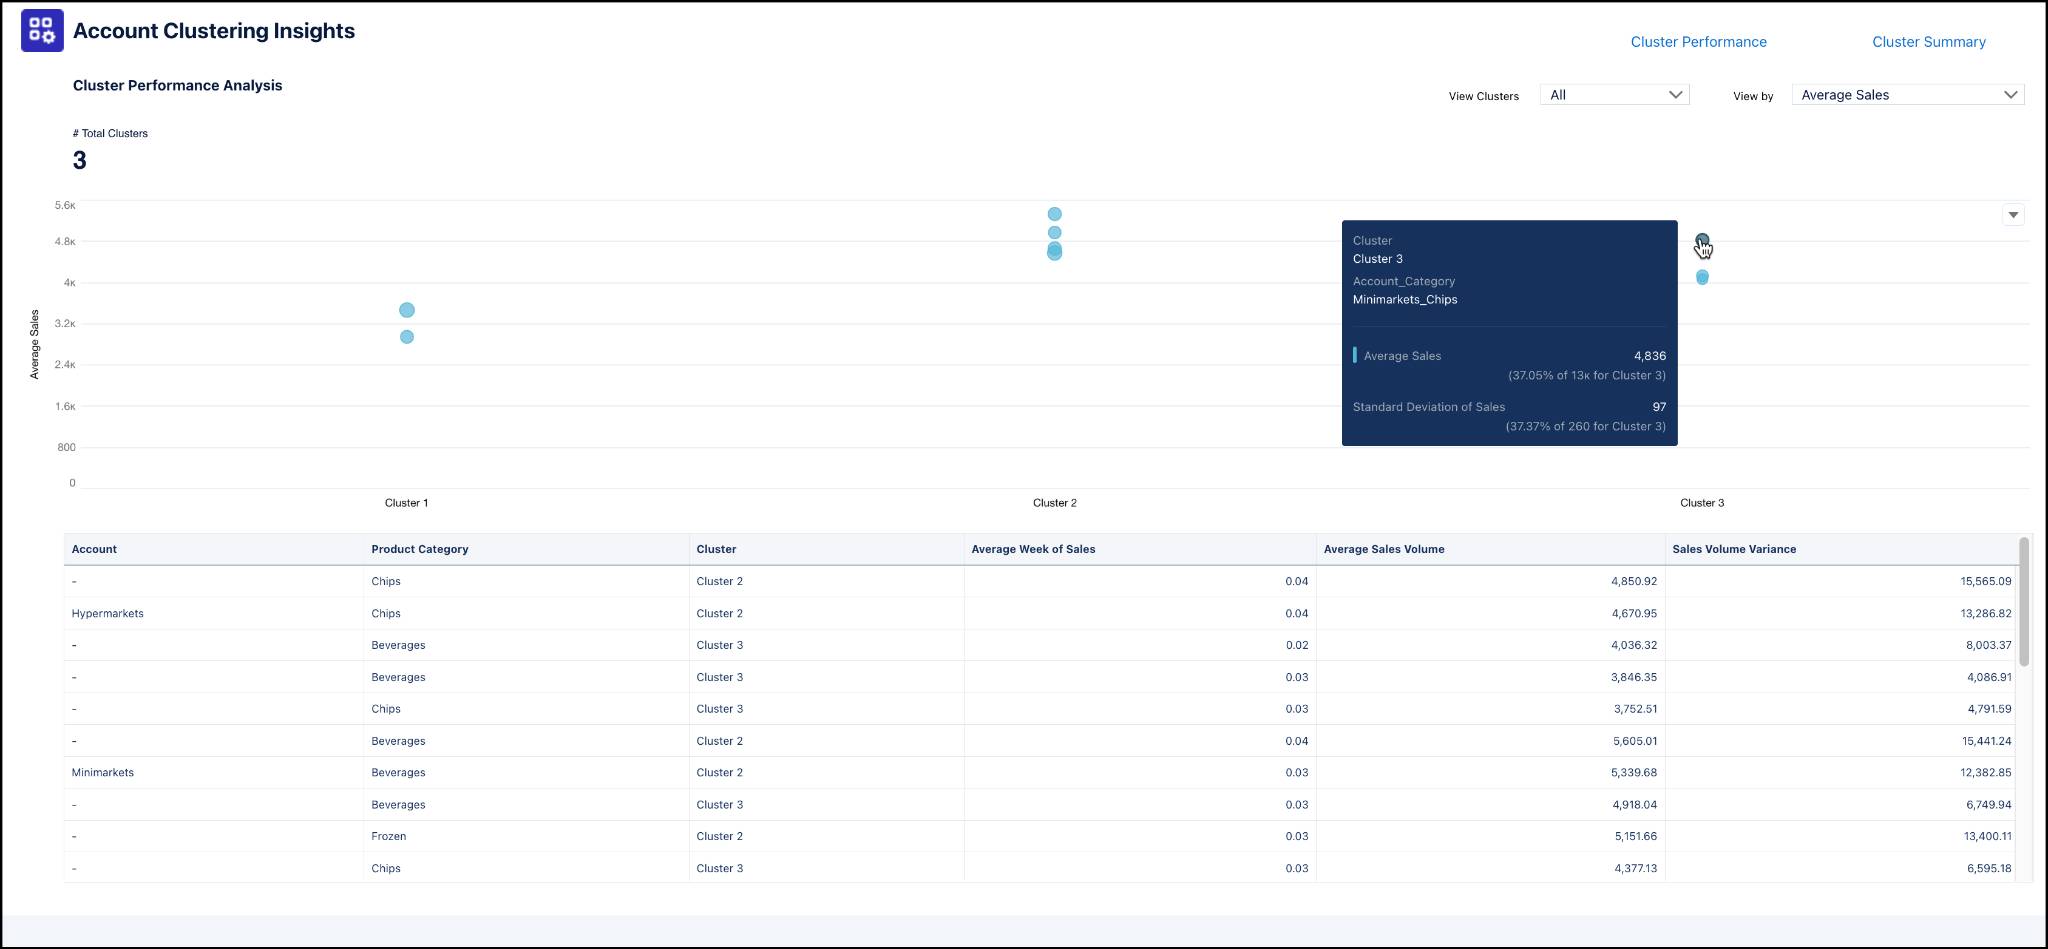
You can also see detailed summaries, including relationships between accounts and clusters and important performance indicators.
Fatima is making progress! She’s created an app that clusters accounts and product categories. Now, she’s ready to create another app to forecast baseline sales volume forecasts.
Scoring Framework for Baseline Sales Volume Forecasts
Next, learn how to create an app that generates the baseline sales volume forecasts for your products. This app gives KAMs insights into expected sales and product performance without measuring the effects of promotional efforts.
As before, first create another CSV of external data and TPO Calendar data, and then create a CRM Analytics template configuration for the baseline sales forecast.
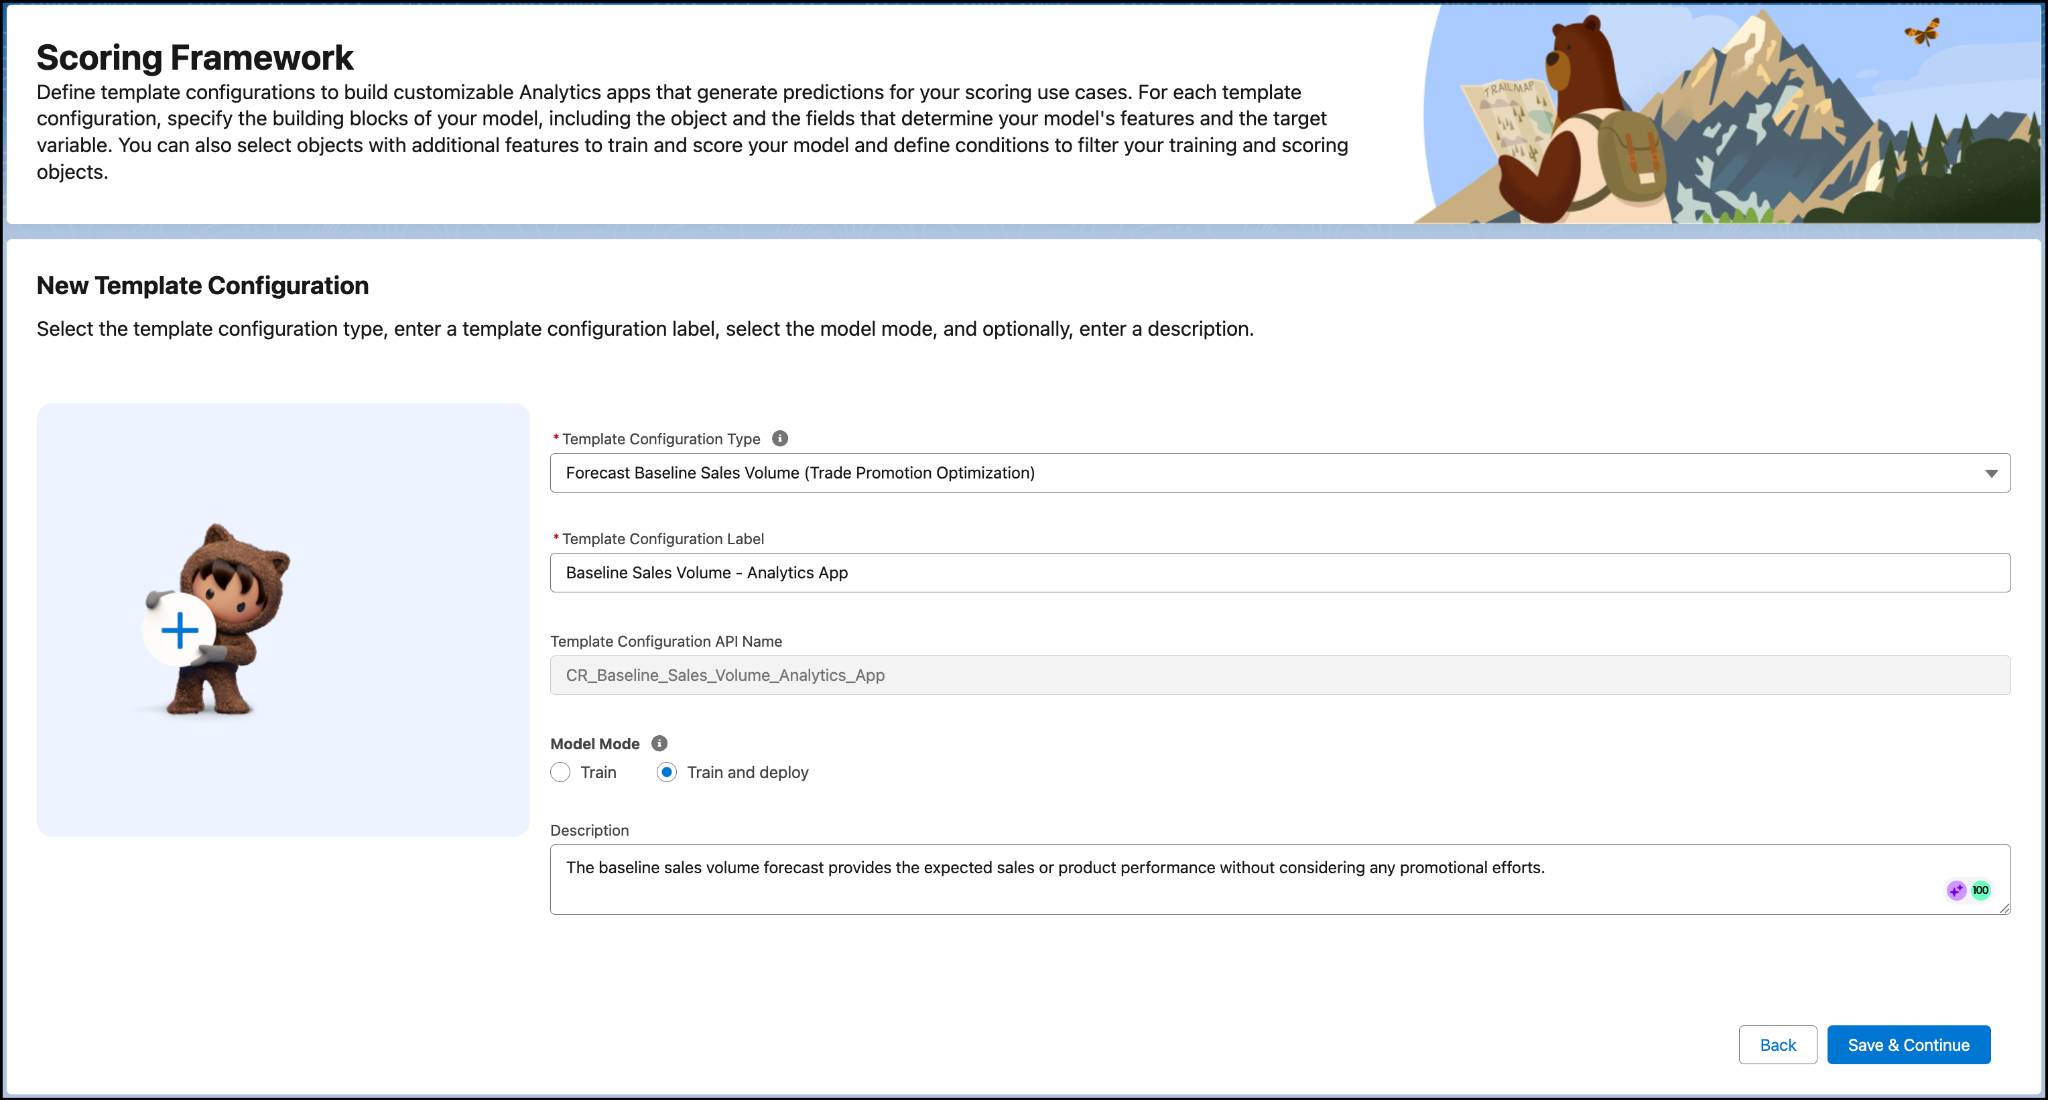
For this template configuration, use the Forecast Baseline Sales Volume template configuration type, and set the model mode to Train and deploy.
After this step, use Scoring Framework to configure the data for training the model, define the accounts and product categories, and filter the datasets.
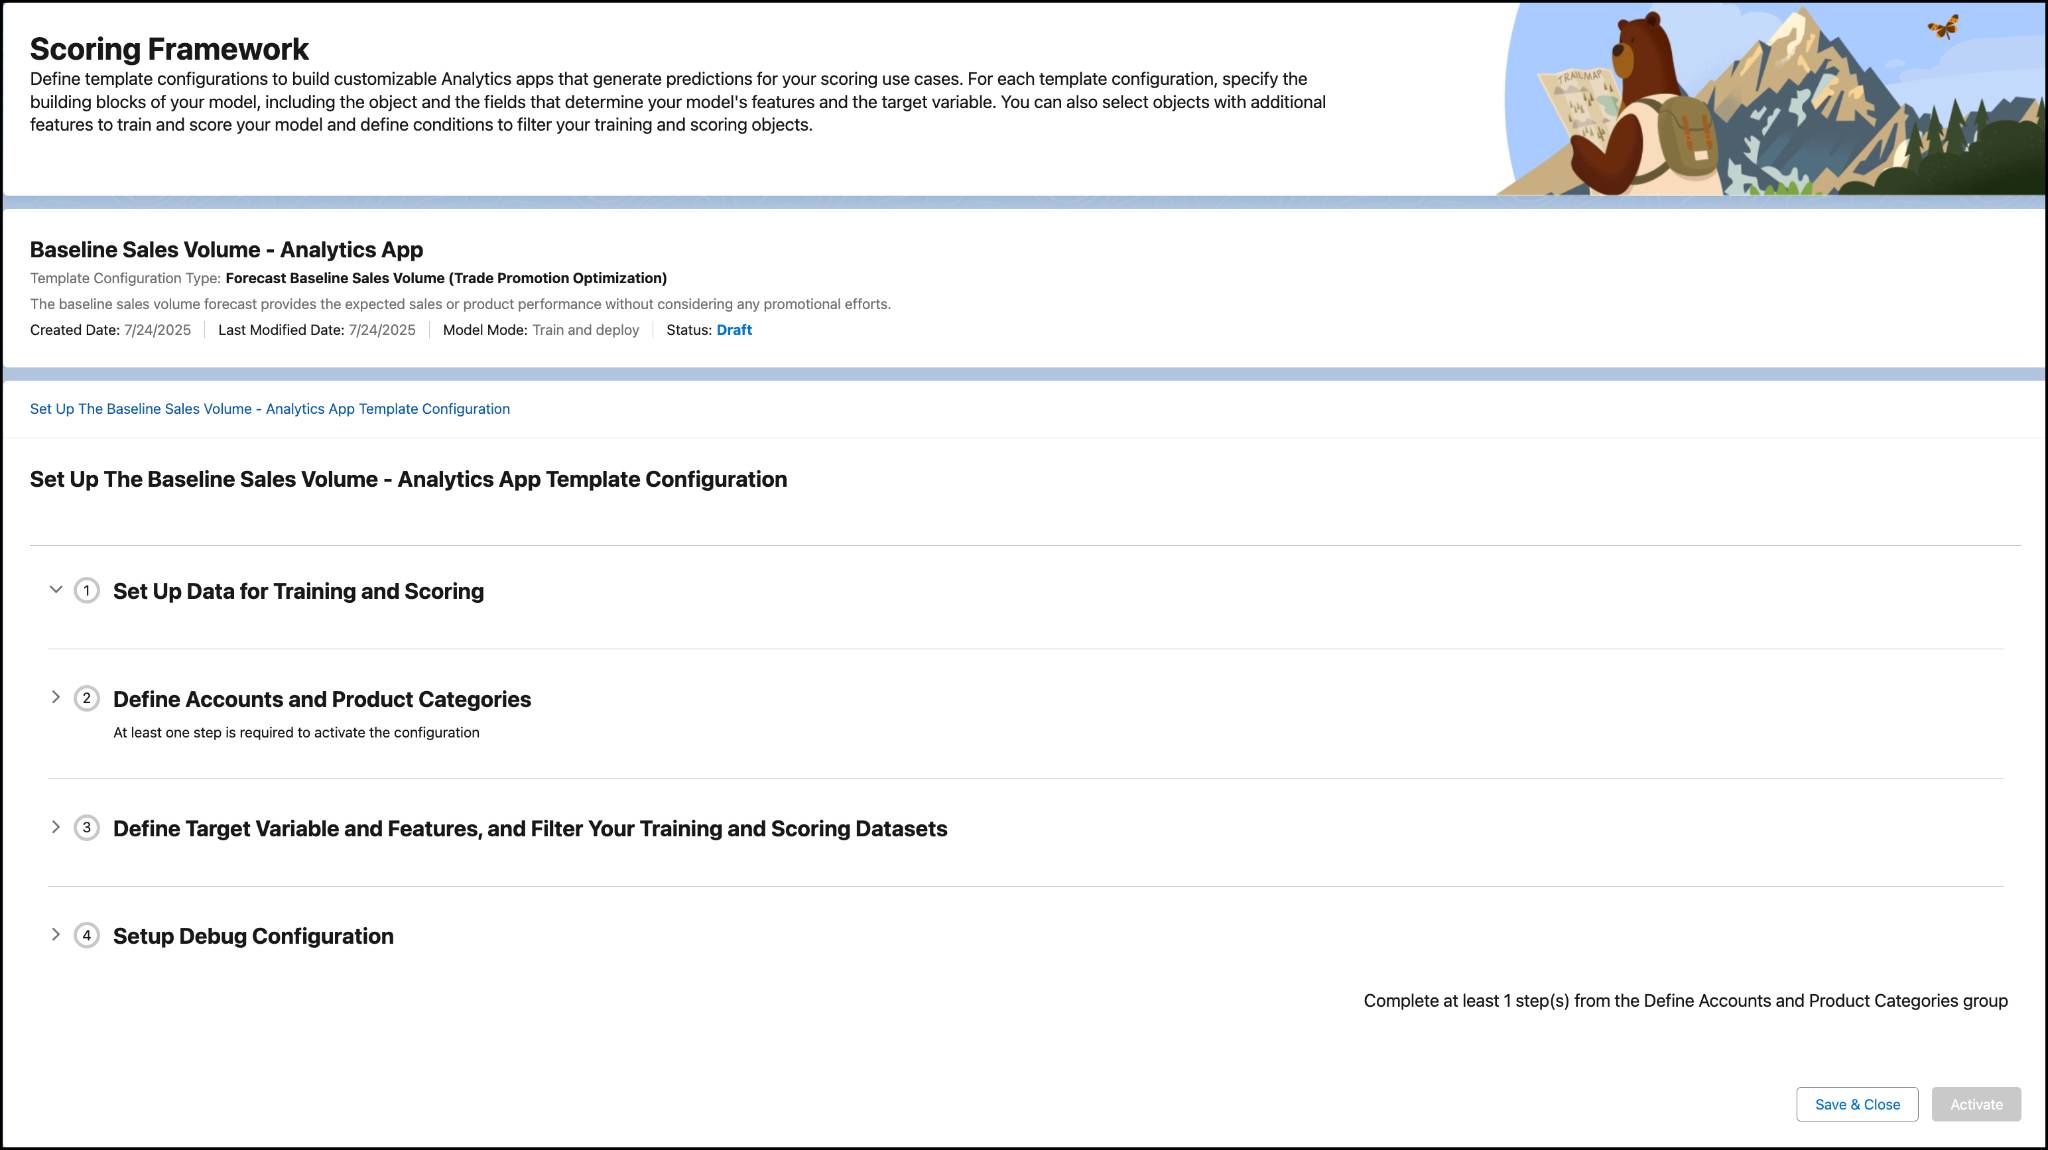
To learn how to define accounts and product categories and set up dataset filters, see Create a CRM Analytics Template Configuration.

Just like the CRM Analytics app you created for clustering the accounts and product categories, the analytics app that you create for baseline sales volume forecasting contains preconfigured recipes that generate datasets. It also includes a baseline sales predictions model, which is used to generate predictions on the number of sales units. For example, the Get Seasonal Products recipe processes promotional and nonpromotional feature data, and identifies seasonal products based on the threshold and seasonal week input that you select. To learn more about the recipes and data sets you can include, visit the CRM Analytics App Assets Help article.
The Forecasted Baseline Sales dashboard shows the predicted baseline sales values for your promotional products.

With this dashboard, you can:
- Analyze sales volume based on the current and predicted baseline, and identify the impact of promotions on overall sales.
- Filter the chart based on duration, seasonality, account, product category, and product.
- Quickly view accounts and products with negative forecast values to identify potential sales setbacks and optimize your strategies.
You’ve now seen how to set up baseline sales forecasting. Next, take a look at uplift volume predictions.
Scoring Framework for Predicting Sales Uplift Volume
The Sales Uplift Volume Predictions app predicts how specific promotion plans and key performance indicators (KPIs) affect sales by comparing them to the initial baseline sales forecast for products.
Fatima follows the same steps that she completed earlier to create a template configuration for the baseline sales volume forecast.
The CRM Analytics app you install based on the template configuration contains the preconfigured Get Model and Dataset Details recipe. This recipe combines promotional and nonpromotional data, aggregates data by account and product category, records predictive model information with the current date, and creates a dataset to store this information.
The app also contains the Sales Uplift Volume Predictions model. The recipe you saw earlier uses this model to generate predictions on the number of sales units.
After setting up the app, Fatima’s configuration is now complete! Now, it’s time for Gustavo to reap the rewards.
Predict Uplift Volume
To predict uplift volume, go to the Advanced Promotions tab of the Trade Promotions Management app and select a promotion to analyze. When you select Predict Uplift, the app automatically forecasts the uplift in sales volume.
By using a combination of baseline and uplift volume forecasts, Gustavo quickly views potential growth in sales. He then makes the necessary improvements to his trade promotion strategies and maximizes the predicted increase in volume.
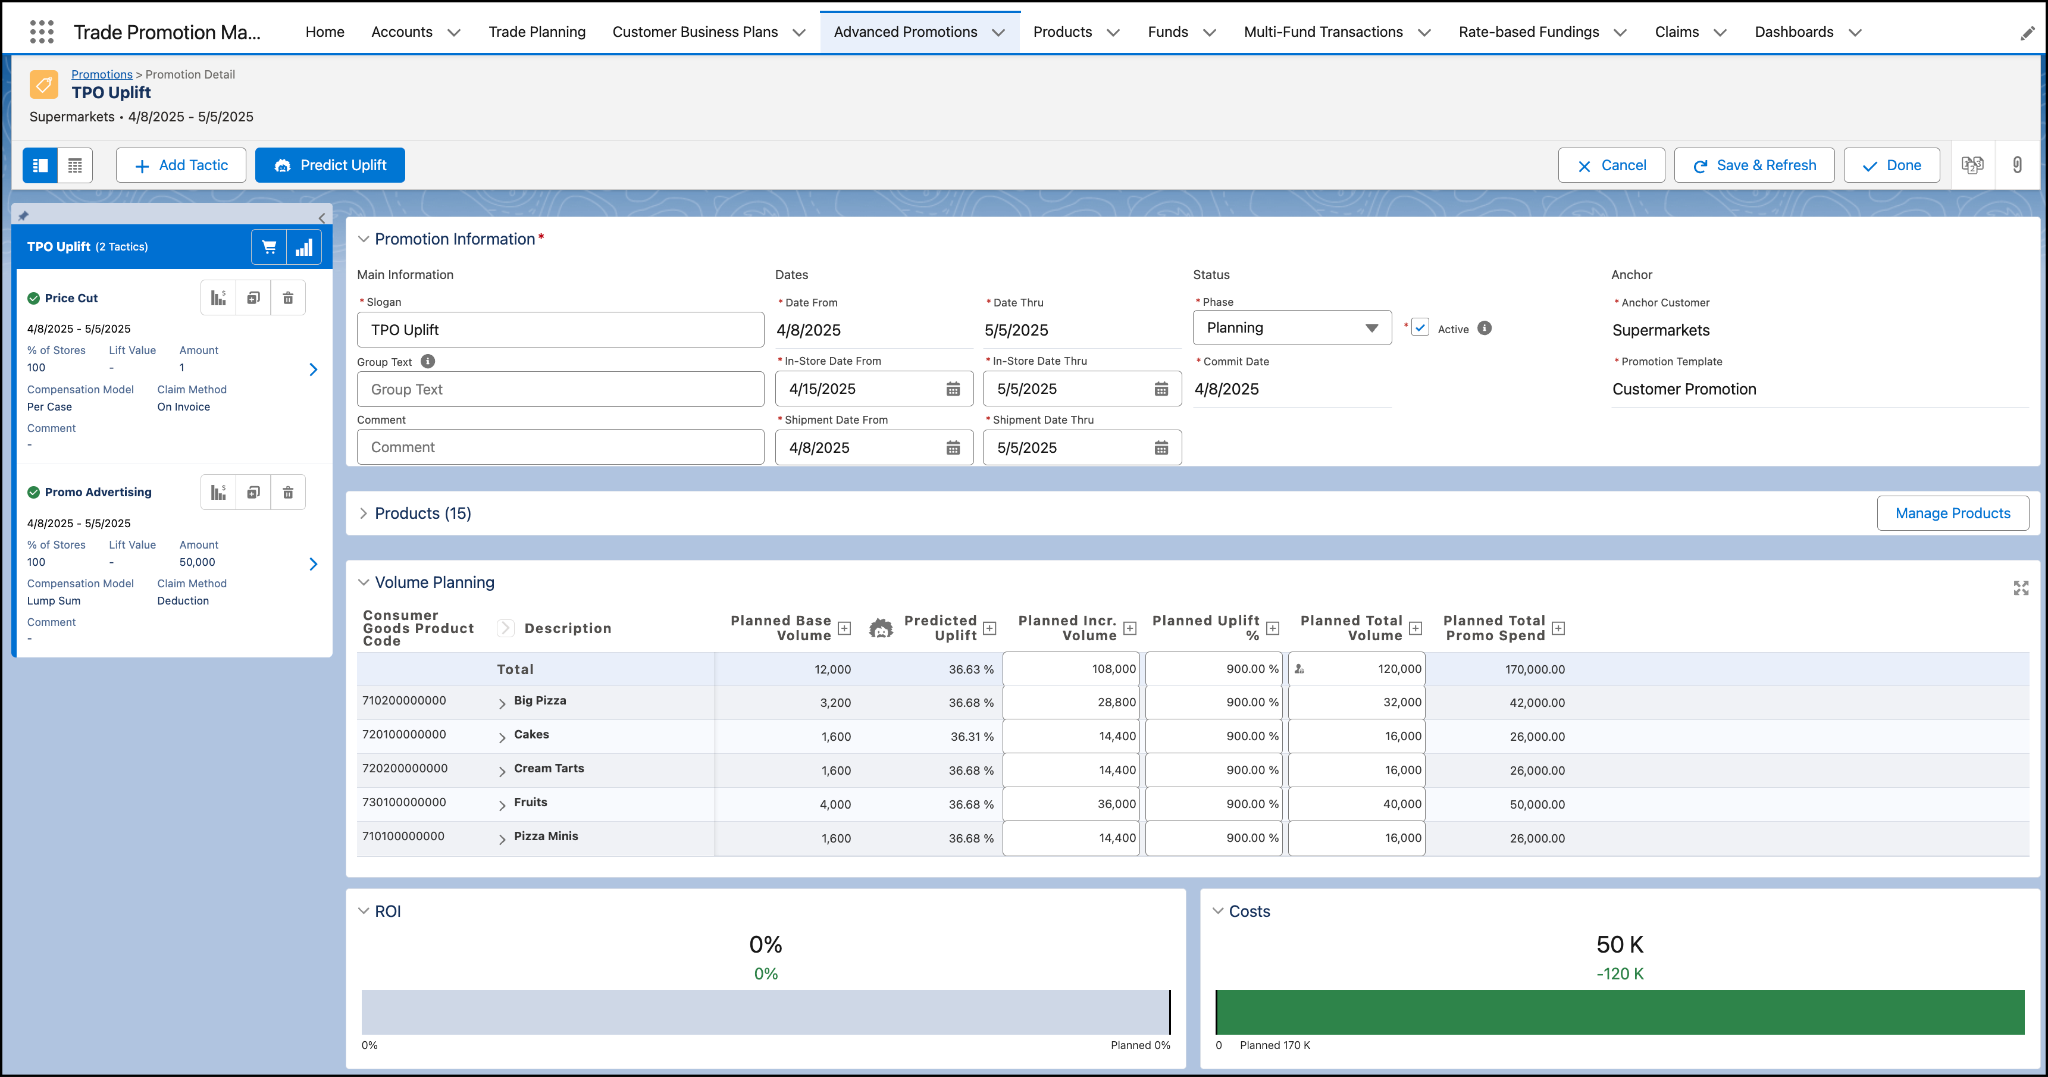
In the Volume Planning section, you can see the planned base sales volume of the selected products, along with the predicted uplift percentages for each product. Or you can customize the KPI definitions in TPM to match your business needs.
With this forecast, Gustavo and his team can improve the effectiveness of Alpine Group product promotions, and maximize their returns.
Wrap Up
Finally, Gustavo can predict product volumes with accuracy during his promotion planning with the help of the Analytics apps and dashboards.
In this badge, you learned how to configure important predictive tools in Agentforce Consumer Goods. Now, it’s time for you to set up your own apps to guide promotion planning. Make sure to review the links in the Resources section to learn all the fine details so you’re well-prepared to configure the scoring frameworks and dashboards.
While your KAMs don’t have the wizardry to predict the success of promotions, the baseline and uplift volume forecasting tools in Consumer Goods are the next-best thing!