Present the Right Amount of Detail
Learning Objectives
After completing this unit, you’ll be able to:
- Identify the right level of detail to make content more understandable.
- Describe how to use filters and limit marks to make visualizations more accessible.
Have you ever had a conversation with a person who didn’t get to the point and kept talking about random things and giving extraneous details? Just like that conversation, visualizations can also overwhelm you with detail. Presenting the right amount of detail in a visualization is an art.
When authoring accessible views, keep the visualization, or viz, simple. Present only the data that your audience needs to make an informed data-driven decision. Nothing more, nothing less. Simplicity helps reduce the noise of a complex viz and allows your audience to more easily analyze your data. This is true for every user, and it’s especially important for people with cognitive disabilities.
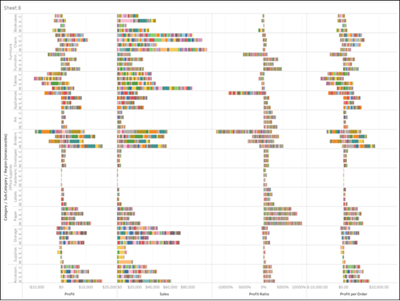
In the visualization shown here, there’s too much content to make sense of the data. We talk more about the need for titles and vertical labels in the next unit. For now, let’s focus on the fact that it’s extremely hard to see what this data is trying to tell us–in this case, which product category in the central region is selling the most.

[alt text: A complex viz showing 21,020 marks.]
So what’s wrong? There are too many marks in this view. In fact, there are 21,020! While in authoring mode, you can find the number of marks in a view by looking at the worksheet.

[alt text: A highlighted section of viz showing that there are 21,020 marks, 68 rows, and 4 columns.]
Can you imagine trying to tab through all of these marks using assistive technology? Let's explore a few ways you can simplify this viz so that it’s more accessible.
Aggregate Your Data Points
Aggregate your data whenever possible to reduce the number of marks you’re showing on your viz. Dense views can be difficult to understand and navigate. Instead of trying to include all the data in one viz, consider creating several vizzes that each answer a data question, and then adding them to a dashboard. That way, you can include all the information but in a few less-complex vizzes that are easier to navigate.
Next, let’s see how, within one viz, you can limit the number of marks in your view and use a filter to display the right amount of data.
Limit the Number of Marks in the View
Limit the number of marks to emphasize only the most important data points. Think about what question you’re trying to answer with your viz. Then, include only the marks that you need in order to answer that question. The overwhelming viz at the beginning of this unit includes too many Measures: Sum of Sales, Profit Ratio, Profit, and Profit Ratio. It also has too many Dimensions: Region, Category, Sub-Category, and Product Name. More fields create a more complex view, and fewer fields create a less complex view. A less complex view reduces cognitive overload.
Let’s say that you need to know which product category is selling best in the central region. You can find the answer with two dimensions instead of four: Region and Product Category. For measures, you can add the most important one, Sum of Sales, to the Rows shelf. You can add the other important measures to the Marks card on the Detail encoding box. That way, viewers can still see the info as a tooltip but aren’t inundated with it.
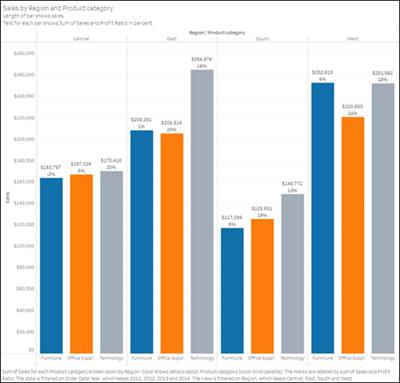
Now this viz has 12 marks.

[alt text: A highlighted section of a viz showing that there are 12 marks, 1 row, and 12 columns in the view.]
It clearly shows which product is selling the best in the central region, and you can still see the Sum of Sales ($170,416) and Profit Ratio (20%) because you’re using Mark labels. This viz is much more accessible.

[alt text: A less complex viz showing 12 marks.]
Use Filters to Reduce the Number of Marks in the View
If it’s not feasible to include fewer marks in your viz, you can use filters that users can toggle through. Let's say you're building a viz where the important dimensions are Region and Product Category. For measures, you’d like to know the Sum of Sales, Profit Ratio, and Sum of Profit. With that data, you would have a viz with 35 marks, which isn’t too bad.
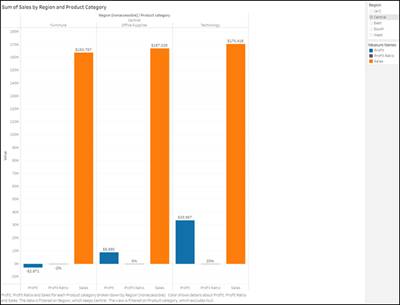
But let’s do better. Let’s add a filter so that you can focus on one region at a time. In the following updated viz, a filter has been added for Region. Now, there are nine marks, and the viz is easier to navigate, and thus more accessible.

[alt text: A filtered viz showing nine marks and horizontal labels.]
To add a filter to your viz, drag the field you’d like to filter to Filters. To show the filter on your worksheet–which adds interactivity for your users–right-click the Filters box and select Show Filter.
A filter card appears on the side of the viz, and your user can choose to show All or filter by Region.
You can change the filter mode for your filters. The filter modes that support more accessible vizzes in Tableau are Multiple Values (list) and Single Value (list).
The filter in the preceding viz is a Multiple Values (list). This filter mode allows the user to select more than one box at a time, which allows them to show more than one field.
The Single Value (list) contains radio buttons and allows users to select only one item at a time. Giving your users Single value filters keeps your marks minimized and less complex.
You can choose to format your filter as a dropdown menu instead of a list. In the Single Value (dropdown), only one item can be selected at a time. In the Multiple Values (dropdown), more than one value can be selected at a time. Remember that the more values you show, the more complex and less accessible your viz is.
To change your filter type, right-click the Filter card and select the filter type you’d like to display. You can also change the filter title, exclude values that aren’t relevant, and hide the filter if you decide that you no longer want to display it.
Limit the Number of Colors and Shapes
You can use color and shapes to differentiate marks in your view. This is a great way to enhance the visualization for sighted users. However, for users with visual impairments, using color or shapes alone isn’t effective. Make sure you use text labels in addition to color and shapes to differentiate marks and communicate information about the data to your users. Include a color and shape legend on your viz with clear titles to identify what the colors and shapes represent.
It’s important to ensure color contrast between elements of your viz. The WCAG recommends a text to background contrast ratio of 4.5:1, and a contrast ratio of 3:1 for non-text items.
If you’re showing a dimension on Color or Shape, be mindful of the number of colors and shapes you use within a single viz. Depending on the color palette you choose, colors can start to repeat themselves. Most color palettes have 10 or more colors, but our smallest palettes (such as Lightning Light) only have 6. If you have more marks than colors on your chosen color palette, use a filter to limit the number of marks shown at a time and reduce confusion.
You may have noticed a common theme around making your vizzes more accessible: adding text. Add text labels instead of relying on colors and shapes. Add titles to your viz, filters, and legends. But how do you do that? We show you in the next unit.