Create Reports and Dashboards
Accessibility
This unit requires some additional instructions for screen reader users. To access a detailed screen reader version of this unit, click the link below.
Open Trailhead screen reader instructions.
Know what bosses love more than a safe space station? Reports and dashboards! Now that you've created your Space Station Construction app, make sure your supervisors can quickly check your progress.
Create a Report
A report in Salesforce is a list of records that meet the criteria you define. It’s displayed in Salesforce in rows and columns, and can be filtered, grouped, or displayed in a graphical chart. You'll create a report to monitor your supply costs for each Space Station being constructed.
- Click the App Launcher
 and select Space Station Construction.
- Click the Reports tab and click New Report.
- Click the Other Reports category.
- Select Space Station with Supplies and click Start Report. (If you don't see the Space Station with Supplies report type, go to Setup and click Object Manager. Next to Supply click the drop-down, then click Edit. Under Optional Features, check Allow Reports. Click Save. Then go back and create the report.)
- In the Add column search, search for Quantity, Unit Cost, and Total Cost fields and add them as columns. (You can also drag the fields from the Fields pane into the Columns section.)

- In the Add group search, enter
Space Station Nameand select Space Station Name. This will separate the report by individual Space Station records.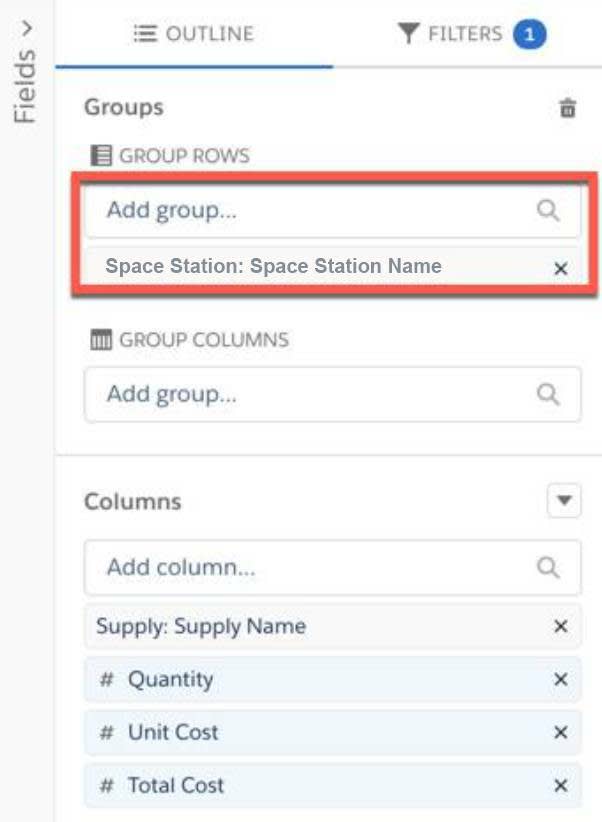
- Click the Update Preview Automatically toggle to view column menus.
- Open the menu on the Quantity column and select Summarize, then deselect Sum.
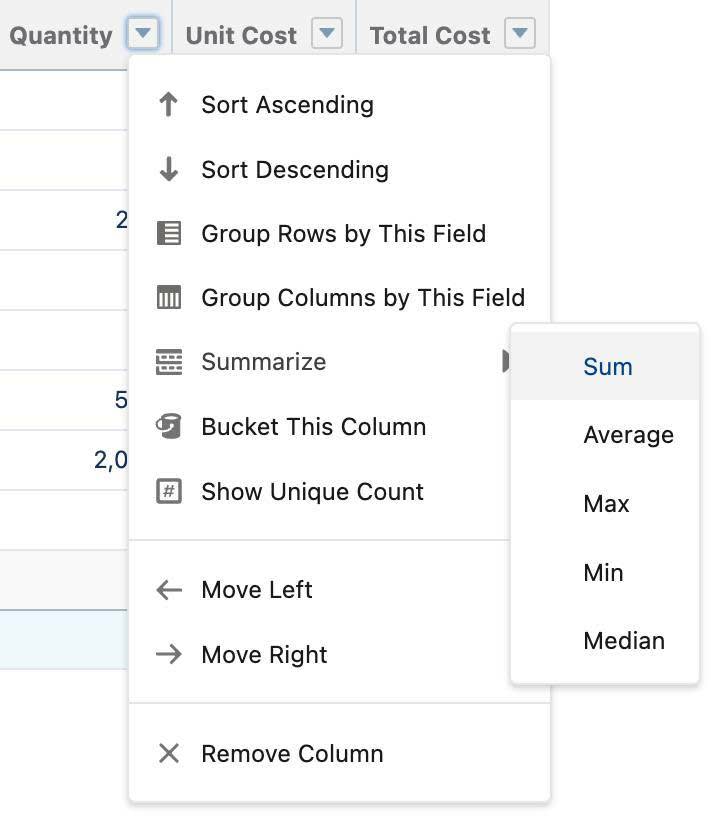
- Open the menu on the Unit Cost column and select Summarize, then deselect Sum.
- Click Save & Run, enter
Suppliesfor the Report Name and click Save.
You should now see a subtotal for your Space Station. As you build more Space Stations, this report will allow you to monitor multiple Space Stations from one report. Your boss will be pleased with you and certainly give you the rest of the day off to star gaze.
Create a Dashboard
You can wow the boss even more by adding a number of reports to a dashboard for quick and easy viewing. A dashboard is a visual display of key metrics and trends. The relationship between a dashboard component and report is 1:1; for each dashboard component, there is a single underlying report. Multiple dashboard components can be shown together on a single dashboard page layout, creating a powerful visual display and a way to consume multiple reports that often have a common theme, like number of exhaust ports unsecured, toilet paper usage per Space Station, etc.
- Click the Dashboards tab.
- Click New Dashboard.
- Name the dashboard
Constructionand click Create.
- Click +Widget.
- Select Chart or Table.
- Search and select the Supplies report and click Select.
- Select the Vertical Bar Chart component and click Add.

- Click Save and then Done.
All these new efficiencies and processes means those troublemakers don’t stand a chance! You’ve got automation, reports, validation rules, picklists, custom objects, dashboards, and more. All the things troublemakers just despise. Nothing is slipping through the cracks (or exhaust ports, for that matter) now. Countdown to launch in 10, 9, 8, 7…