Use Summary Formulas in Your Reports
Follow Along with Trail Together
Want to follow along with an expert as you work through this step? Take a look at this video, part of the Trail Together series.
(This clip starts at the 46:39 minute mark, in case you want to rewind and watch the beginning of the step again.)

Summarize Your Data in a Whole New Way
Summary formulas are a great way to calculate additional totals based on the numerical values in your report. In addition to the standard summaries that we used in a previous step, you can add up to five summary formulas to summary and matrix reports to create calculated summaries of your numerical fields. Your VP of Sales knows what each of her reps have in their pipelines; however, she would also like to see how they’re closing deals. Let’s build a report to show how her percentage of closed opportunities are actually being won.
Modify the Opportunities by Rep report to display closed opportunities by sales rep:
- Click the Reports tab.
- Click the arrow
 next to the Opportunities by Rep report, and select Edit.
- Click the Filters pane, click Opportunity Status.
- Select Closed then click Apply.
Add a custom summary formula to display the win rate by sales rep:
- Click the Outline pane.
Note: If some of the following options do not fit on your screen, temporarily zoom out via your internet browser settings.
- Click the arrow
 next to Columns and click Add Summary Formula.

- Complete the following details:
- Column Name:
Win Rate - Description:
Ratio of won to closed opportunities - Formula Output Type: Percent
- Decimal Points:
2
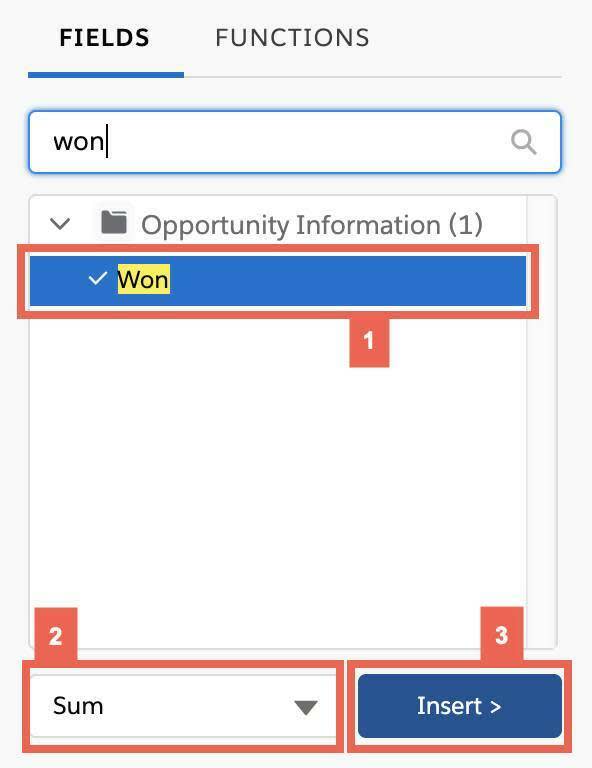
- With the Fields tab selected, enter
wonin the Search Fields search box and select Won under the Opportunity Information section, and then Sum.
- With Won selected, click Insert.
- Place the cursor in the formula after SUM and enter
/.
- In the Search Fields menu, type and select Closed, then select Sum and Insert.
- Ensure your formula looks like this:
WON:SUM/CLOSED:SUM.
- Click Validate to ensure your formula has no errors.
- Click Apply.
- At the bottom of the Preview pane, slide the Detail Rows toggle to off.
Save the report as a new report called Sales Rep Win Rates in the Global Sales Report folder:
- Click the arrow next to Save and click Save As.
- Complete the Save Report details:
- Report Name:
Sales Rep Win Rates - Click in the Report Unique Name text box to auto-populate the unique name. Don't worry, the unique name of this report isn't checked.
- Report Description:
How well are my sales reps closing?
- Ensure this report is being saved to the Global Sales Reports folder.
- Click Save.
- Click Run.
