Build, Run, and Debug an App
Learning Objectives
After completing this unit, you'll be able to:
- Use Simulator.
- Set up Xcode to run apps on a physical device.
- Use breakpoints.
- Troubleshoot and diagnose code.
- Distinguish between errors, warnings, and bugs.
We all make mistakes. Debugging is the process of identifying and fixing mistakes in code. This unit teaches you the tools and practices you need to debug your iOS apps.
Testing your App in Simulator
Now that you've started writing some basic syntax in Swift, you might wonder what your code looks like as a real app. You can build an app and test what the app would look like on devices using Simulator in Xcode.
You should do initial testing of your apps in Simulator because you'll get an accurate representation of every supported device, even older models. These device options are helpful for seeing how your app interacts on devices that you might not have.

But you should still test your app on physical devices if possible. Certain interactions depend on the physical device to run.
For example, if you try to use Simulator to test an interaction with the Camera app, the program crashes. If your code depends on other hardware components that don't exist on a Mac—such as an accelerometer, a gyroscope, or a proximity sensor—you should test your app on a physical device.
You can test the following common features in Simulator:
- See how your user interface (UI) behaves when you receive a phone call. Although you can't accept a call in Simulator, you can see how your app looks in a call status.
- Test how the shake gesture works within your app.
- See what your app does when the keyboard disappears, which is a common UI problem. When you use the Connect Hardware Keyboard option, your Mac keyboard can act as an external keyboard for the simulated device. Use the external keyboard to test what your app does when the simulated keyboard disappears.
- See how Force Touch works within your app.
- Turn on the slow animations option, which is helpful for debugging issues with animations.
- Test GPS features. Simulator doesn't include a real GPS, but you can give Simulator fake locations or use one of the built-in locations.
Simulator has some software limitations that you should consider. For example, push notifications are available only to physical devices. Additionally, the MessageUI framework, which helps compose email and text messages, isn't compatible
with Simulator.
If you encounter issues in Simulator, test the code on your physical device to see if you experience the same issues.
Building and Running an App
The Run button hides the complexity of the build process in Xcode. After you click the Run button, Xcode takes the active scheme and compiles your source into an executable file.
Xcode deploys your executable to Simulator or to your physical device, depending on what you select as your active scheme. Xcode then launches your executable and attaches the debugger.
You'll learn about debugging later in this lesson. First, see what Simulator can do:
1. Create a new project in Xcode, and select the iOS Single View Application template.
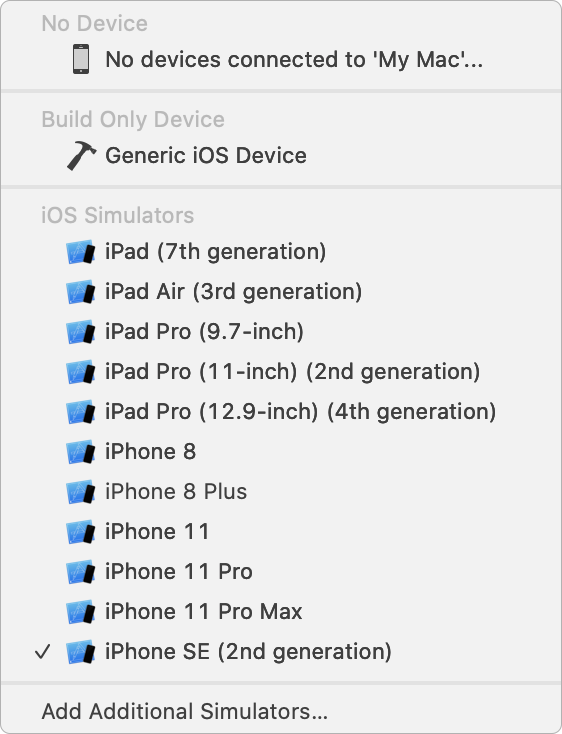
2. From the Scheme menu on the Xcode toolbar, choose the device that you want to simulate from the list.
3. Click the Run button
 to launch the app in Simulator.
When you run an app for the first time, Xcode asks if you want to enable developer mode on your Mac. Developer mode gives Xcode access to certain debugging features. All the units in this module assume that you've enabled developer mode.
After Simulator launches, you should see a device image with a white background. The app is blank because you haven't customized the code.
4. In the Simulator menu bar, choose Devices > Home, and then click through the other apps on the simulated device. Try using some of these features in Simulator:
- Click the device buttons and interact with Siri to see how Simulator reacts like a physical device.
- In the Features menu, toggle the in-call status bar when you're in an app to see how the app reacts.
- Open Safari and search for an image. Use the share button at the bottom of Safari to save the image. The image appears in the Photos app of the simulated device.
- In the Device menu, rotate the image orientation to test how responsive your app is when you switch to landscape mode.
- Drag the corner of the window to resize the device image. For an exact representation of the physical device, point accuracy, or pixel accuracy, use the view options in the Windows menu.
Running apps in Simulator is an important first step of testing. Simulator is usually the first place that you test your code when you're adding new features.
Testing on a Personal Device
Overall, Simulator works well when you're developing and debugging apps, but you should always test your code on actual hardware. Before you can test your code on a physical device, you must have an account from the Apple Developer website.

After signing up for a developer account, add your account to Xcode:
1. Go to the Accounts tab of Xcode preferences.
2. Add the Apple ID for your developer account.
After entering your credentials, you can run and debug apps on a physical iOS device.
3. Connect your iOS device to your Mac using the appropriate cable.
Xcode automatically downloads the necessary information from the device and displays the device name in the Scheme menu.

4. Choose the name of your physical device, which is typically at the top of the list, before the device simulators.
5. Build and run the app again.
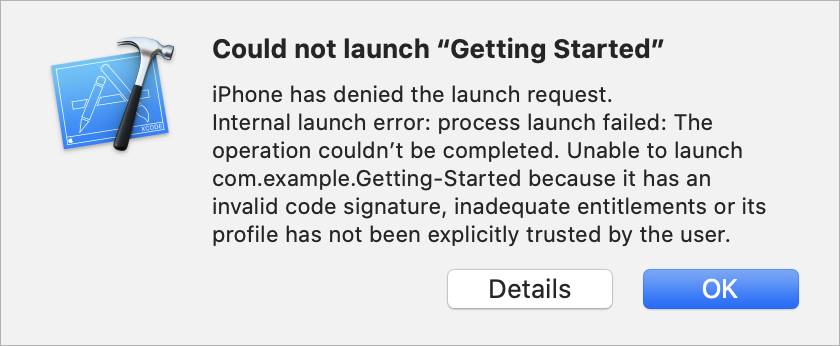
You might receive a prompt that asks you to trust the developer certificate. Follow the instructions in the prompt to allow the device to run your apps.
6. Build and run the app again.
You should see the same simple white screen on your iOS device that you saw on Simulator.
7. To stop the app from running, click the Stop button
 near the left end of the Xcode toolbar.
Enabling Wireless Pairing
Deploy your app over your network so that you don't have to physically connect your device to your Mac each time you test your app:
1. Connect your iOS device to your Mac using the appropriate cable.
2. Choose Window > Devices and Simulators from the Xcode menu bar.
The Device and Simulators window appears.
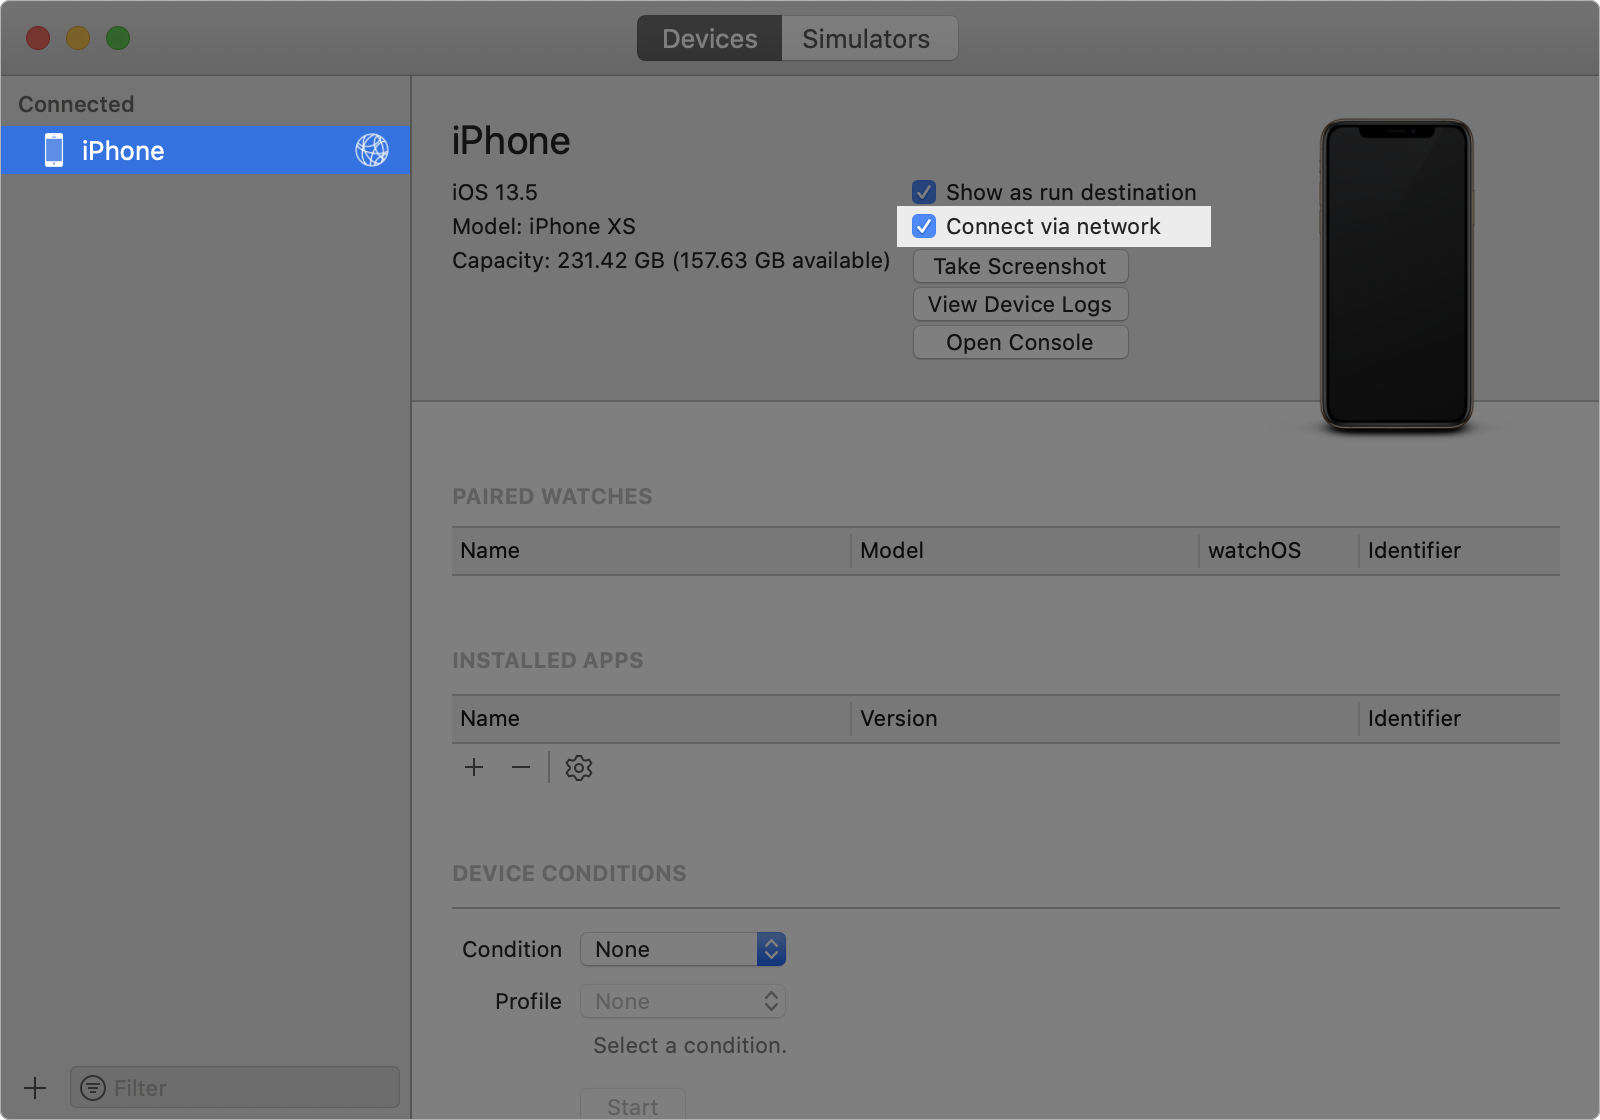
3. Make sure that your device is selected in the Connected pane in the Devices and Simulators window.
4. Select the Connect via network checkbox.
If your device is on the same network as your Mac, a globe icon appears next to your device's name within a few seconds. This icon indicates that your device is wirelessly connected.
5. Disconnect your device from your Mac, and continue to build and run your app wirelessly.
If these steps don't work for you, you might be on a corporate or institutional network where the system administrator has enabled certain network restrictions.
In this case, manually pair your device to Xcode:
1. Choose Window > Devices and Simulators in the Xcode menu bar.
2. Control-click your device
3. Click Connect via IP Address in the dropdown menu that appears.
4. Enter your device's IP address in the prompt, then click Connect.
- To find you device's IP address, go to Settings > Wi-Fi.
- Find the network you're connected to. If you're not connected to a network, connect to one you trust.
- Tap on the blue circle with the "i" in the middle.
You can now continue to build and run your app wirelessly.
Debugging an App
When you add new features to your app, you should stop and test these changes. Testing small changes is easier than testing big changes. When you test, expect to find that some features don't work as you had planned. Sometimes these problems are obvious, such as when the compiler generates an error or warning about your code. Bugs are less obvious issues that require more work to discover and resolve.
When you launch your app from Xcode, the app is automatically connected to the Xcode debugger. Use the debugger to watch the execution of your code in real time. Using the debugger's stepping functionality, execute your app incrementally, pausing to inspect how its state changes after each step. This ability is especially useful when you attempt to isolate bugs.
You'll commonly encounter three types of issues: warnings, errors, and bugs.
Warnings
Warnings are the simplest kind of issues to fix because they indicate non-critical problems with your code. You should resolve warnings, but they won't prevent your app from running normally. The compiler generates warnings when it builds your code.
Some conditions that generate warnings include the following:
- Code that can't execute
- Variables that never change
- Deprecated, or out-of-date, code
Do the following steps to see how warnings work in Xcode.
1. Open the ViewController.swift file.
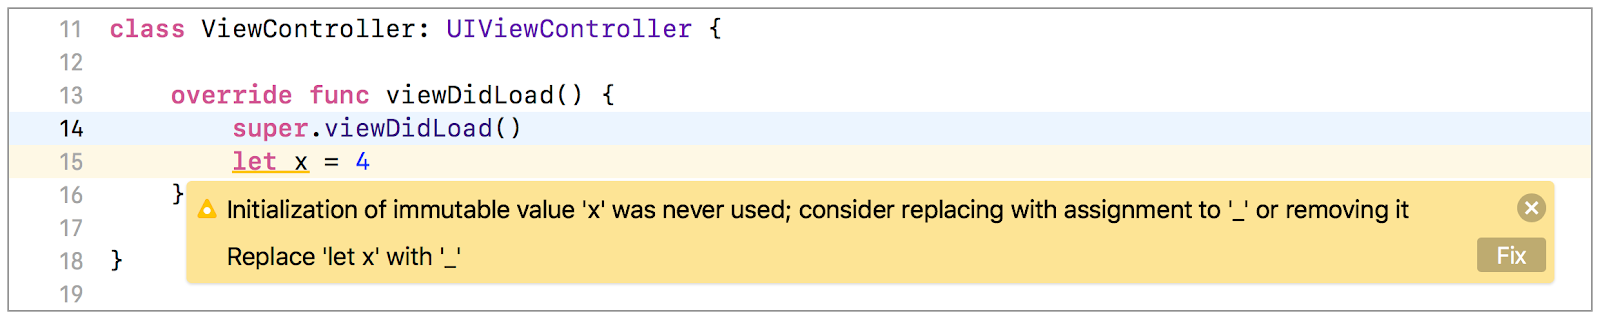
2. Change the viewDidLoad() method to look like the following:
override func viewDidLoad() {
 super.viewDidLoad()
 let x = 4
}
This new line assigns a value of 4 to a constant named x.
3. Build your app using Command-B.
Notice that a yellow (triangle) warning icon and message appears next to this new line of code.
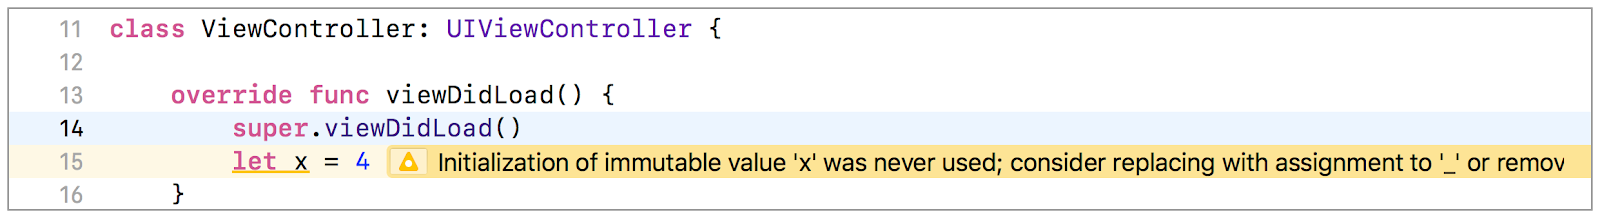
In this example, the warning tells you that the new value is never used and provides a few suggestions about how to fix the issue.
4. Click the yellow triangle on the left of the warning message to expand the box.
The warning message doesn't always fit within a single line of text. Xcode usually provides suggested fixes at the bottom of the expanded box.
Remember that warnings won't prevent your app from running normally. Ignore this issue for now.
Errors
Sometimes you'll write code that can't compile, possibly because of a mistyped name or the use of incorrect syntax. This type of issue causes the compiler to generate an error. You must resolve errors before you can build and run your app.
To understand this concept, introduce an error in your ViewController.swift file.
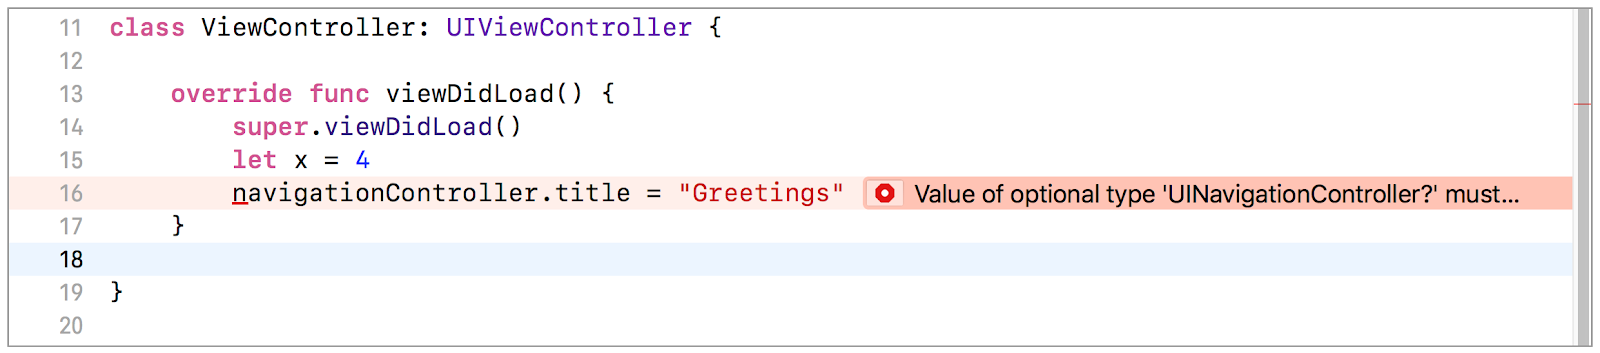
1. Add a new line at the bottom of the viewDidLoad() method:
navigationController.title = "Greetings"
2. Build your app using Command-B.
Notice a red error message appears by the new line of code.
3. Click the red circle on the left of the error message to expand the box.
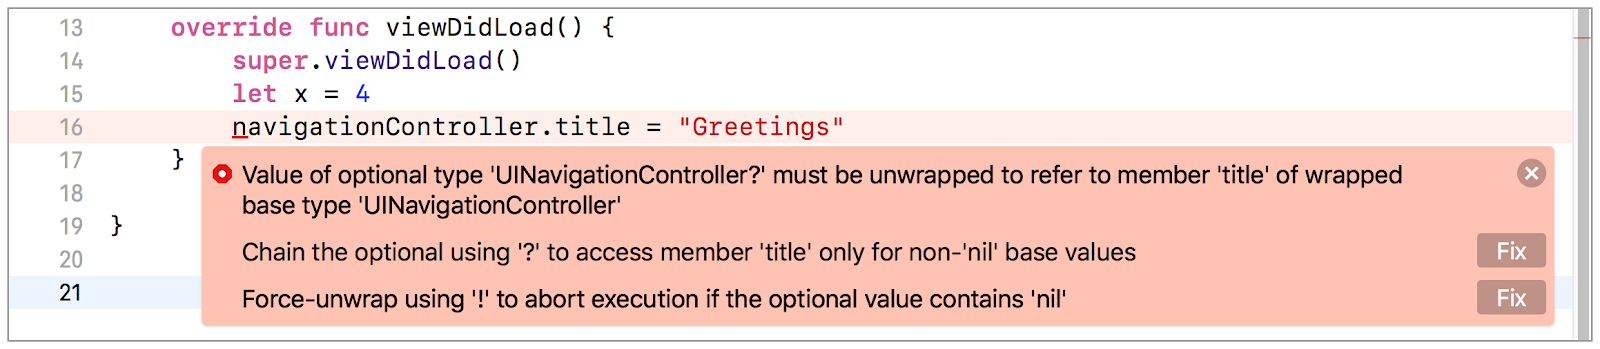
Notice the complete error message and suggested fixes at the bottom. Your app won't compile until you fix the issue.
4. Resolve the issue by clicking the Fix button next to one of the suggested fixes.
Not all errors have obvious fixes. You can't always rely on Xcode to provide a suggested fix. Read the information provided in the error message carefully for hints about what is wrong. Remember that errors are commonly caused by mistyped names or erroneous syntax. Look for these simple mistakes first.
Before you continue, remove the new lines from your viewDidLoad() method. The method should be as follows:
override func viewDidLoad() {
 super.viewDidLoad()
}
Bugs
The compiler is proficient at finding simple issues in your code and generating warnings or errors. Bugs are more complicated issues that result in runtime problems, such as crashes or unintended behavior. Mistakes in logic usually cause these issues. While you resolve warnings and errors before you ship your app, users often discover bugs as they navigate the app.
Apple designed some features of Swift to prevent certain types of bugs. For example, optionals help Swift apps avoid null pointer exceptions, which are crashes caused by inadvertently attempting to access restricted memory. Although Swift helps you write better code, you'll still encounter bugs. Learning how to identify and resolve bugs is a critical skill that you'll develop through practice and experience.
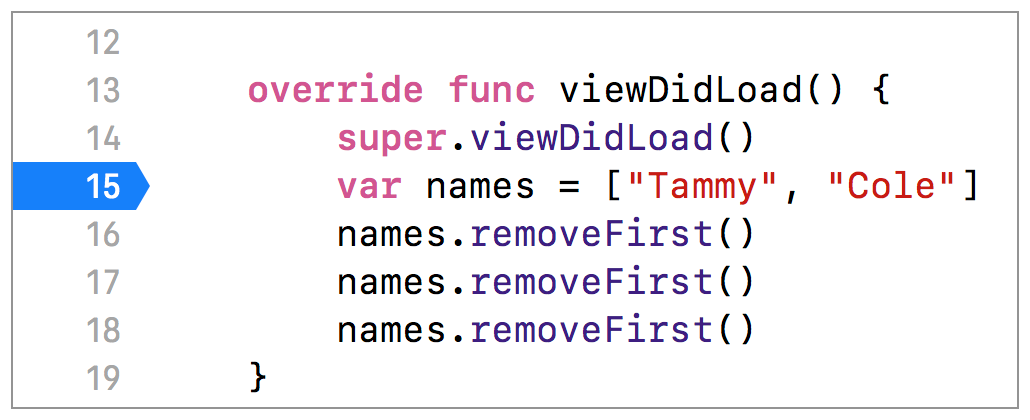
In ViewController.swift, add the following lines of code below super.viewDidLoad():
var names = ["Tammy", "Cole"]
names.removeFirst()
names.removeFirst()
names.removeFirst()
You might not be familiar with Swift at this point, but these lines are simple to understand. names is a list containing two pieces of text, Tammy and Cole. Each subsequent line removes the first item from
the list. The removeFirst() method is called three times, but only two items are in the list. See what happens when you run the app:
1. Build your app.
Since the syntax is valid, the Build Succeeded message appears.
2. Run the app.
After a few seconds, the program crashes, and the following message prints to the console:
Fatal error: Can't remove first element from an empty collection
The program crashes when it attempts to remove an element from an empty list. This bug might seem obvious, but bugs can be very deceptive. When you don't immediately know the cause of a bug, begin by debugging the code around where the crash occurs.
Using Breakpoints
A breakpoint causes your app to pause at a specific point when running in the debugger. While your app is paused, you can inspect the state of your variables to better understand why your app is behaving unexpectedly.
Add a breakpoint to help diagnose the problem with the list:
1. Create a new breakpoint by clicking in the gutter to the left of the line where you want the app to pause. In this case, add a breakpoint on the line var names = ["Tammy", "Cole"].
2. Build and run your app.
Notice that the program pauses execution at your breakpoint. The highlighted line has not yet executed.
On the left side of the debug area, look at the Variables View. The variable names has 0 values. Can you determine why?
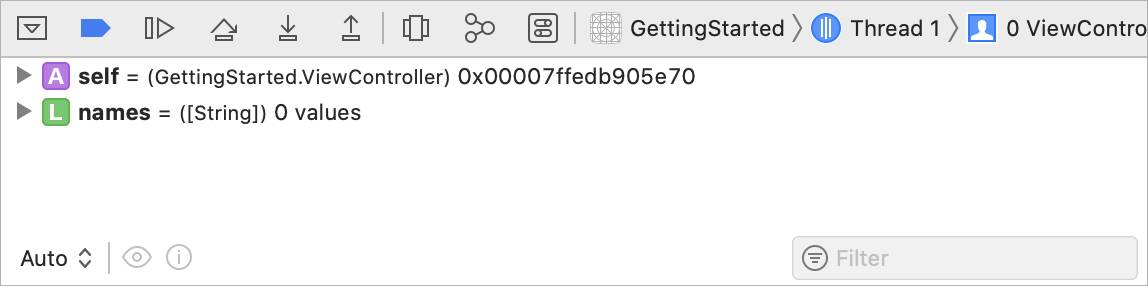
The highlighted line has not yet executed. That's why the names list has no values.
Stepping
You can finely control the execution of your app using a feature of the debugger known as stepping. Stepping is a common feature of modern debuggers. In Xcode, access the stepping controls from the bottom of the editor area, directly above the Variables View.

Take a look at each of the stepping controls:
-
Continue
 : Resume code execution until the next breakpoint is reached or the app finishes.
 -
Step over
 : Execute the currently selected line of code, and then pause execution.
 -
Step into
 : If the currently selected line is a function call, advance execution to the first line of that function, and then pause execution. Otherwise, this control behaves like a step over.
 -
Step out
 : Execute all remaining lines in a function and pause execution on the line after the function call.
Use the stepping controls to advance to the last line of code:
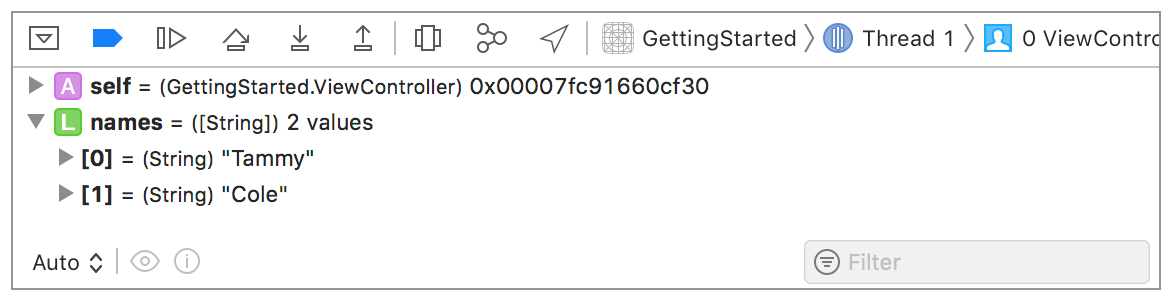
1. Click the step over button.
The names list now has 2 values.
2. Click the disclosure triangle to the left of names to see its values.
3. Click the step over button again, removing the first element from the list.
Notice that the views list now has 1 value remaining.
4. Click the step over button again, removing the second element from the list.
The views list now has 0 values.
All of the values have been removed from the views list. However, the currently selected line of code attempts to remove another element. When this code executes, your app crashes. Using simple debugging techniques you've verified that the
list is empty before the last removeFirst() method call.
Fix your issue by removing the last line of code.
Making Mistakes
Even the most experienced programmers introduce bugs. As a programmer, you'll encounter bugs similar to the one above. Don't be discouraged when you find bugs in your own code. Debugging is a skill that improves through practice and experience. As you gain more experience building iOS apps you begin to recognize and avoid many types of bugs.
Lab: Debug Your First App
Overview
The objective of this lab is to find and resolve compiler errors, runtime errors, and compiler warnings.
Part 1: Find and fix compiler errors.
1. Download and open the Xcode project FirstTimeDebugging.
2. Try to run the app.
Note that the app doesn't run because of a few compiler errors. As you've learned in this unit, red symbols (octagons) in line with the mistake (or where the compiler guesses the mistake is) indicate compiler errors. The Issue navigator also lists all compiler errors.
3. Fix the compiler errors so that you can run the app.
More common mistakes that could cause this app's compiler errors include the following:
- Missing or extra parentheses or braces (whether opening or closing)
- Referencing a function or property with incorrect spelling. The compiler is literal, expecting you to reference a function or property exactly by the name you gave it.
Sometimes a single mistake can cause the compiler to flag multiple errors. Fixing one mistake sometimes eliminates all remaining errors.
Part 2: Find and fix runtime errors.
Were you able to remove all the red error symbols from the project? If so, find and fix a runtime error:
1. Run the app.
Notice that the app stops execution right after opening in Simulator and that a red line appears across one of the lines of code on the screen. This indicates an error occurred during execution.
2. Look at the text in the console area for clues to identify the issue.
Try to solve this runtime error. Consider adding breakpoints at and before the affected code, and then run the app again.
Part 3: Find and fix compiler warnings.
Now that the app runs, focus on a few final problems:
1. Open the Issue navigator.
Notice three yellow triangles indicating several warnings.
2. Address all of these warnings.
Congratulations! Your project should be free of compiler errors, runtime bugs, and warnings.
Check the Solution if You Need It
Here is the project with the errors fixed. You can compare it to the project linked above to see what changes were made.