Collaborate with CRM Analytics
Learning Objectives
- Present from the dashboard.
- Use annotations to call attention to CRM Analytics dashboard results.
- Share dashboards in Chatter and download widget data.
Follow Along with Trail Together
Want to follow along with an expert as you work through this step? Take a look at this video, part of the Trail Together series.
(This clip starts at the 9:50 minute mark, in case you want to rewind and watch the beginning of the step again.)
Take It to the People
You know now that CRM Analytics dashboards are well-thought-out maps that give you many paths through your data. And you’re not in the wilderness alone. As you’ll see in this unit, there are many ways to make progress toward goals through working with others.
Now it’s time to meet with your sales reps and show them how CRM Analytics can help them, too. You’re going to present the Regional Sales dashboard and demonstrate annotating, posting, and downloading. These are all powerful ways to hold conversations around your data and put your insights to work for your business.
Present a Dashboard in Full-Screen Mode
- Click the Analytics Studio tab and click Home. Under Recents, click Regional Sales.
- Click the present icon (
 ). If you have two screens, you can continue in full screen mode. If you have only one screen, click the X in the upper right corner to exit full screen mode.
Note that in full screen mode, you have the app control bar, which includes options to share, annotate, and set notifications. - Hover at the top of the screen to show the team how to access the operating system menu bar.
- Click the dropdown next to the dashboard name to open the app navigation list.
Here are the other dashboards in the app, you tell your team. But we’re going to focus on the map now. - Click Canada in the map.
The bar chart and table facet accordingly. There are oohs and ahs from around the room.
Use Annotations to Highlight Results

- In the Regional Sales dashboard, hover near the upper-right corner of the bar chart and click to open the drop-down menu. Select Annotate.

- In the annotations panel, type
Take a look at the Canadian numbers!
- To attach a screenshot of the dashboard, click the checkbox.
Attaching a current screenshot shows the dashboard’s filtered state, so that others see what you’re referring to. - Click Share.
Your comment appears in your Chatter feed, and it’s saved with the dashboard. Anyone who’s following the dashboard sees your comment and can join a conversation about the chart and its data. - To see the indication of the annotation on the widget, click the Show Annotations icon (
 ) in the dashboard controls. (You might have to click it twice if the panel closes at first.)
Notice the blue square with the number in the upper-left corner of the chart. That tells you how many annotations are on that widget. - In the annotations panel, click the left arrow to see a list of annotations, and then click your annotation to open it and view its feed.
- Type a comment,
Almost caught up to the USA!and click Comment. When you’re finished with a conversation, you can resolve annotations. Notice that the annotations panel lets you toggle between Open and Resolved annotations.
 - Click the check mark in the upper right of the panel to resolve and remove the annotation from the Open list.
Later, if you want, you can reopen the annotation or delete it.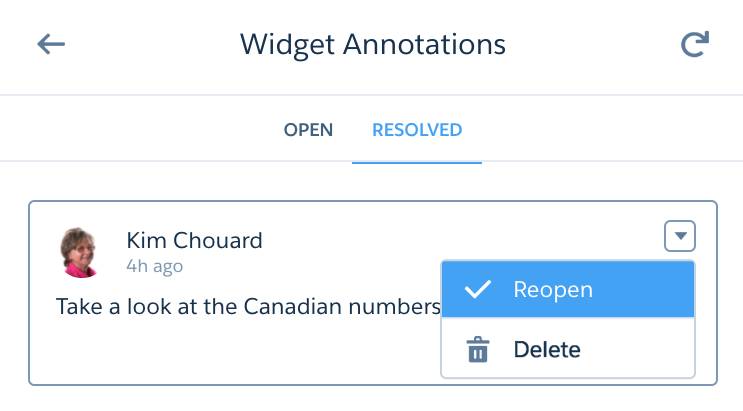
Share Dashboards with Others in Your Org
- Click the Share icon (
 ) to share the whole dashboard.
In the resulting dialog, there are tabs for different actions. You can set up sharing options, post a dashboard screenshot to Chatter, get a URL to share, or download a screenshot. - Click the Get URL tab.
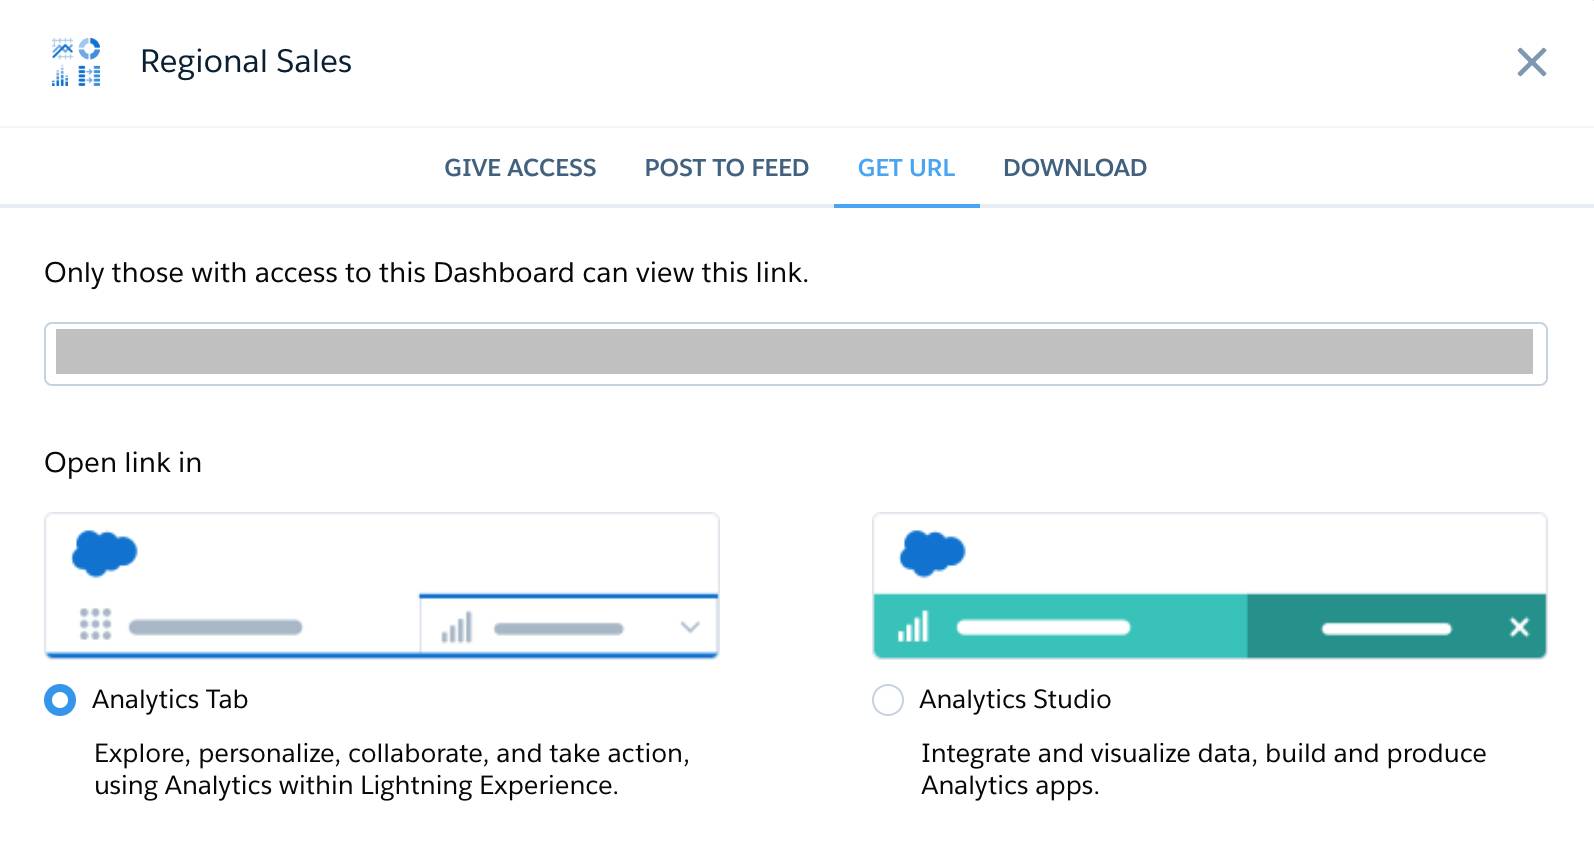
- If it’s not already selected, click Analytics Tab so that the URL you share will open the dashboard in the Analytics tab.
- Copy the link.
You tell your team to paste the link into an email when they want to share the dashboard with another group. Your admin has set up CRM Analytics to give everyone in your org access to the sales app. Keep in mind that only colleagues who have access to the dashboard can view the link.
Take the Conversation to Chatter
- In the Share dialog, click the Post to Feed tab.
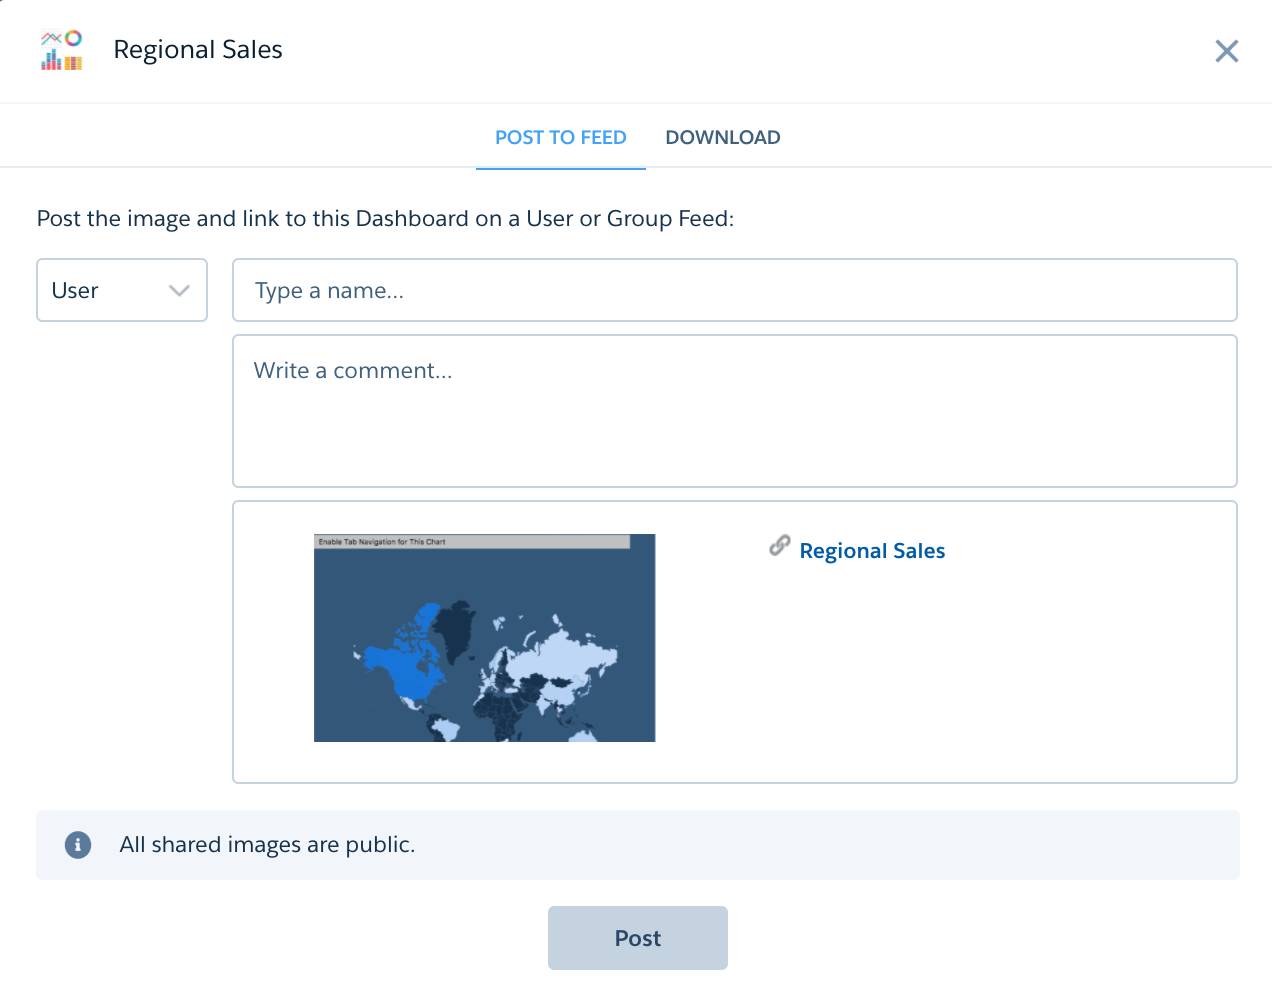
- In the name field, type “Laura” and select Laura Garza when the auto-suggestion offers it.
- In the comment field, type
Laura, please take a look at this dashboard and post back if you know why Canada has almost caught up with the U.S. - Click Post.
This sends your post to Laura’s Chatter feed. From the post, she can click the image of the chart to open the dashboard and explore it herself.
You tell the team that posting is a great way to get the conversation going in Chatter. You can at-mention others and get the wisdom of the group to work for you. But you caution them to be aware of posting screenshots of dashboards with sensitive data. Screenshots can be copied and shared anywhere inside or outside of your organization. - To go to your Chatter feed to see the post, first click the X in the upper-right corner to exit full-screen mode.
- From the App Launcher (
 ), find and select Sales. (If you don’t see Chatter at first, then click the Chatter tab.)
 - In the comment field on the post, enter
Team, remember that any posted image becomes public.and click Comment.
Download Data from a Dashboard Widget
You—and CRM Analytics—have just the thing: One of the collaboration tools lets you download filtered data from a widget. It just takes you a couple minutes to show everyone how to get the data out of a widget and into a CSV file the team can use. Of course, going from CRM Analytics to Excel feels like moving backward. But some folks on the team are total spreadsheet whizzes and are more comfortable working that way. (At least until they can see how cool CRM Analytics is!)
- From the App Launcher (
 ), find and select Analytics Studio. In Analytics Studio, you can access the dashboard directly, instead of viewing it within the running app.
 - Locate and click the Regional Sales dashboard.
The dashboard opens in preview mode, where you can share from individual widgets. - Hover at the upper-right corner of the map widget and click to open the dropdown menu. Select Share.
- In the Share dialog, click the Download tab.

- Click Download in CSV Format.
- Now locate the downloaded file and open it.
You see a small subset of data, just what was presented in the chart. The download contains the results of the widget’s query.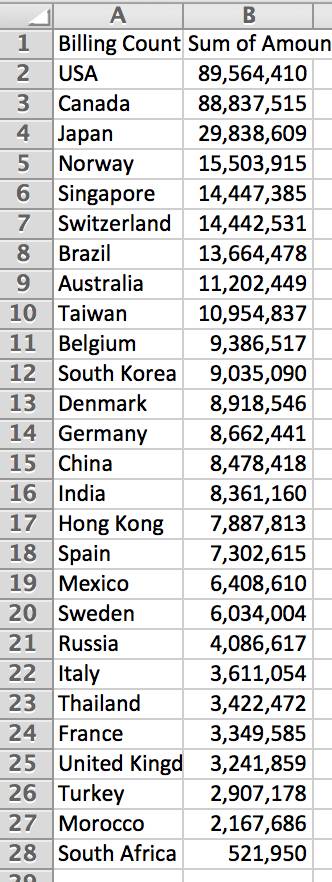
Your analyst applauds from the back of the room: Just what the team needs to combine their Excel data with data from the CRM Analytics query. Now they can do v-lookups and other formulas to their hearts’ content and correlate their data with the country-by-country analysis from the widget filter.
And—even better—the analyst chimes in about how impressive CRM Analytics looks, saying perhaps it’s time to move the team from spreadsheets to dashboards. Once they get there, they can upload all their data to include it for future analysis in CRM Analytics. But that’s a story for another time. (If you’re interested in learning about getting data into CRM Analytics, see the Data Integration Basics module.)
You’re a Dashboard Navigator Now
And take the challenge below to get your Trailhead badge!