Use the Data Pane and Analytics Pane
Learning Objectives
After completing this unit, you’ll be able to:
- Explain what’s contained in the Data pane.
- Distinguish between measures and dimensions.
- Describe what you can do from the Analytics pane.
Your Data: Get the Big Picture
You’re about to paint a picture with data using Tableau.
Before you paint that picture, stand back and see what tools you’ve got to work with. Use the Data pane and the Analytics pane on the left side of the workbook to take stock of your data fields and analytics tools. Toggle between the Data pane and Analytics pane by clicking the tabs at the top of the side bar. You use these fields and tools to build views of your data.
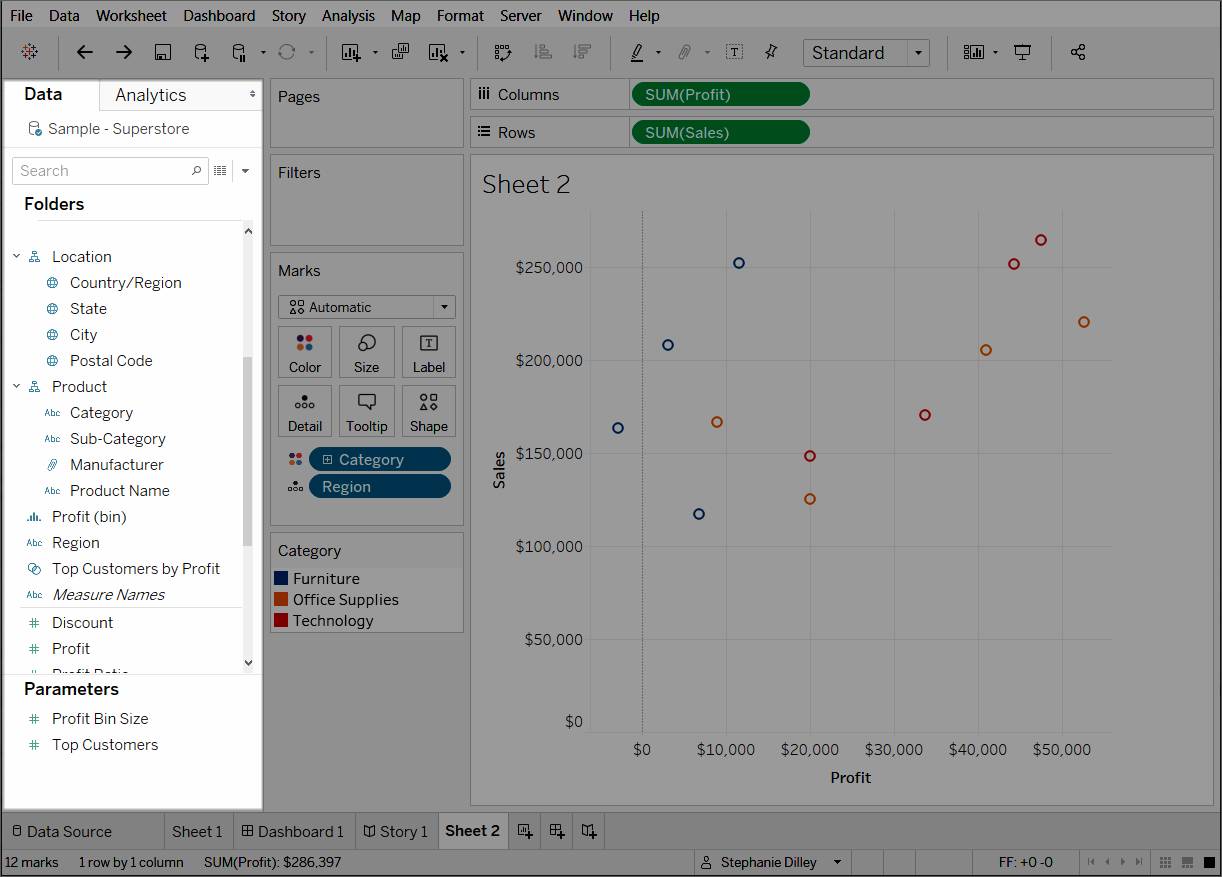
The Data Pane: A Palette Full of Data
As soon as you connect to your data and set up the data source with Tableau, you see the data source connections and fields in the Data pane. If the Tableau workbook is your canvas, then the Data pane is your palette. You use the fields here to paint your picture, that is, build visualizations.
Current data source connections appear at the top of the Data pane. If you have multiple available connections, click the one you want to start working with. Tableau displays the fields for that connection.
Measures and Dimensions
In the Data pane, Tableau automatically categorizes your data into two kinds of fields.
-
Measures: These are things you can count or measure. Temperature, profit, and frequency are all measures. By default, fields containing numerical values are measures.
-
Dimensions: These are things that you can use to categorize, segment, or reveal your data. Region, color, and age range are all dimensions. By default, fields containing text, date, or Boolean values are dimensions.
Measures and dimensions are the fields you use to create your viz. Categorizing your fields this way helps you determine what you can measure and compare. It makes it easy to answer the questions you want to pose, such as:
- How much growth was there by this category?
- How large is each group?
- Which percentage of the whole is taken by each of my defined segments?
For a deeper understanding of dimensions and measures, read Dimensions and Measures, Blue and Green.
Sets and Parameters
Depending on the data source, you might also see sets and parameters in your Data pane, and you can create new sets and parameters, if needed. Sets are fields that are subsets of your data, while parameters are specific values that act as placeholders as you interact with a view. For more information, check out Create Sets and Create Parameters.
The Analytics Pane: Add More Features to Your Painting
If you’re looking to add extra features to your view, go to the tools in the Analytics pane. At the top of the Data pane, click the Analytics tab. You can find tools to quickly add meaning to your data.

The tool you choose depends on what you want to show with your data. From the Analytics pane, you can drag items such as average reference lines, box plots, trend lines, and forecasts to your viz.
Add an Analytics Object to the View
If you want to add an item from the Analytics pane, simply drag it into the view. When you drag an item from here, Tableau shows the possible destinations for that item: Do you want to drop it onto the table, a pane, or a cell? The range of choices varies depending on the type of item and the current view.
In a simple case, the drop target area offers three options.
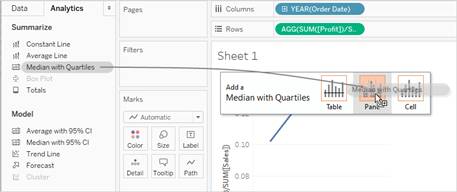
The terms table, pane, and cell define the scope for the item you’re adding.

Now that you’ve learned about the Data pane and Analytics pane, let’s learn about the rest of the workspace, and how where you add fields can affect what your picture looks like.
Resources