Get Started with Tableau
Learning Objectives
After completing this unit, you’ll be able to:
- Describe how Tableau can help a nonprofit better meet its mission.
- Explain how a nonprofit can get access to Tableau.
Build a Better World with Data
Your nonprofit acquires more information about clients, supporters, and advocates now than ever before. Do you know how to find the most relevant data? Is it siloed in spreadsheets, locked in various databases, or hidden by the sheer volume of information?
Enter Tableau, an analytics platform that helps people see and understand data. Tableau allows you to quickly answer questions with data and share insights across your organization using powerful, interactive dashboards.
With Tableau, nonprofits can connect to the data they care about, combine data from multiple sources, and see the data in visualizations that can help highlight trends and outliers. These vizzes, as they are affectionately known, can be shared securely across your organization, with your board of directors, and with your donors and advocates.

Tableau can help nonprofits to nurture a data culture that supports more strategic decision-making around how to garner deeper engagement from supporters, deliver services more effectively, or expand the reach of their programs. In this unit we offer a short list of some mission-critical things you can do with Tableau—to jump-start your imagination for how this powerful platform can help your organization:
- Analyze donor behavior.
- Monitor and report on impact in real time.
- Advocate and educate with data.

Analyze Donor Behavior
Tableau enables development teams to analyze supporter data for insights to help increase donor engagement. It also brings together donor data with external data sets like demographic, wealth, and consumer data to surface patterns that will help you target new supporters. And Tableau’s visualizations can help you better tell your story of impact to donors and institutional funders who, now more than ever, want to understand the social return they are getting on their investment in your programs.
Let’s take a quick look at how a nonprofit might use Tableau to optimize its fundraising efforts.
No More Homelessness (NMH) is a (fictional) nonprofit that works to help individuals and families transition to permanent housing through case management, benefits advocacy, food and clothing distribution, and other services. NMH uses Salesforce for Nonprofits to manage its fundraising, client services, and advocacy work.
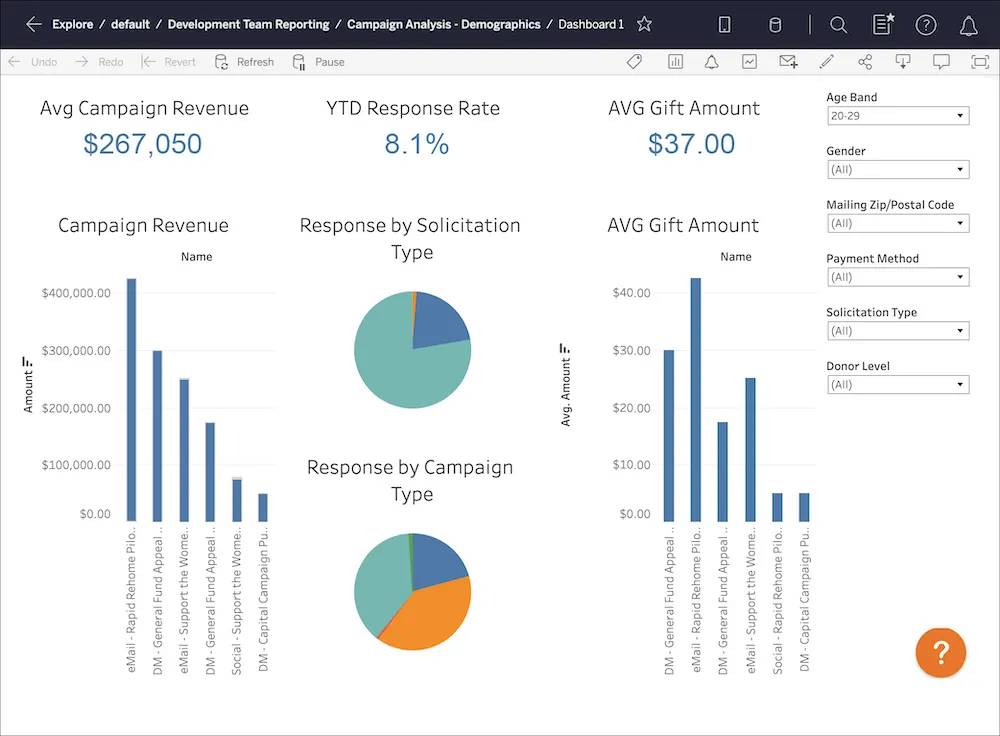
Because it’s more efficient to retain donors than to acquire them, Aniyah Thompson, the Development Director at NMH, wants to better understand the organization’s donors and move beyond transactional engagements to personalized relationships. The NMH Technology team set up Tableau Desktop and Tableau Dashboards for Nonprofit Fundraising (more on that in the next unit) to pull in relevant donor data directly from Salesforce. Using drag-and-drop tools, the staff created additional views of the data based on the Development team’s requirements, and assembled those views into dashboards.
From these dashboards, Aniyah can view and explore individual donor profiles; review funding results, performance, and campaign analytics; and answer just about any question she might have about her team’s strategy and performance. When Aniyah wants to dig into success metrics by fundraiser, for example, she can easily filter her view by who made the ask of a donor, then save it as a custom view that she can quickly return to later. She can even use natural language to ask questions of the data like, “How many gifts have we brought in this year?” as a starting point for further exploration—and all without having to contact the Technology team for support.
Recently, Aniyah’s team reviewed its quarterly campaign metrics and noticed that donors and volunteers in their twenties were five times more likely to respond to project-based solicitations focused on NMH’s advocacy work. The team also saw significantly higher conversion rates with this segment of donors when it provided a text-to-give option. As the Development team starts planning for next quarter, it decides to specifically target young professionals with a mobile-first campaign about its fight against the installation of hostile architecture in public spaces. In this example, having data-driven insights allows the NMH Development team to focus its resources effectively, with the added benefit of increasing its returns.
Monitor and Report on Impact in Real Time
NMH also uses Tableau to analyze its program impact and effectiveness. The two ready-made Tableau Accelerators for Nonprofit Program Management, which we’ll review in the next unit, help the staff at NMH quickly understand trends around service delivery, plan with better insight into staff capacity and client intake limitations, and use data to drive other decisions.
NMH also works with dashboards to show real-time results to volunteers and funders, uses data as the foundation for how it tells its story of impact, and can analyze trends to respond to developing needs in the community.
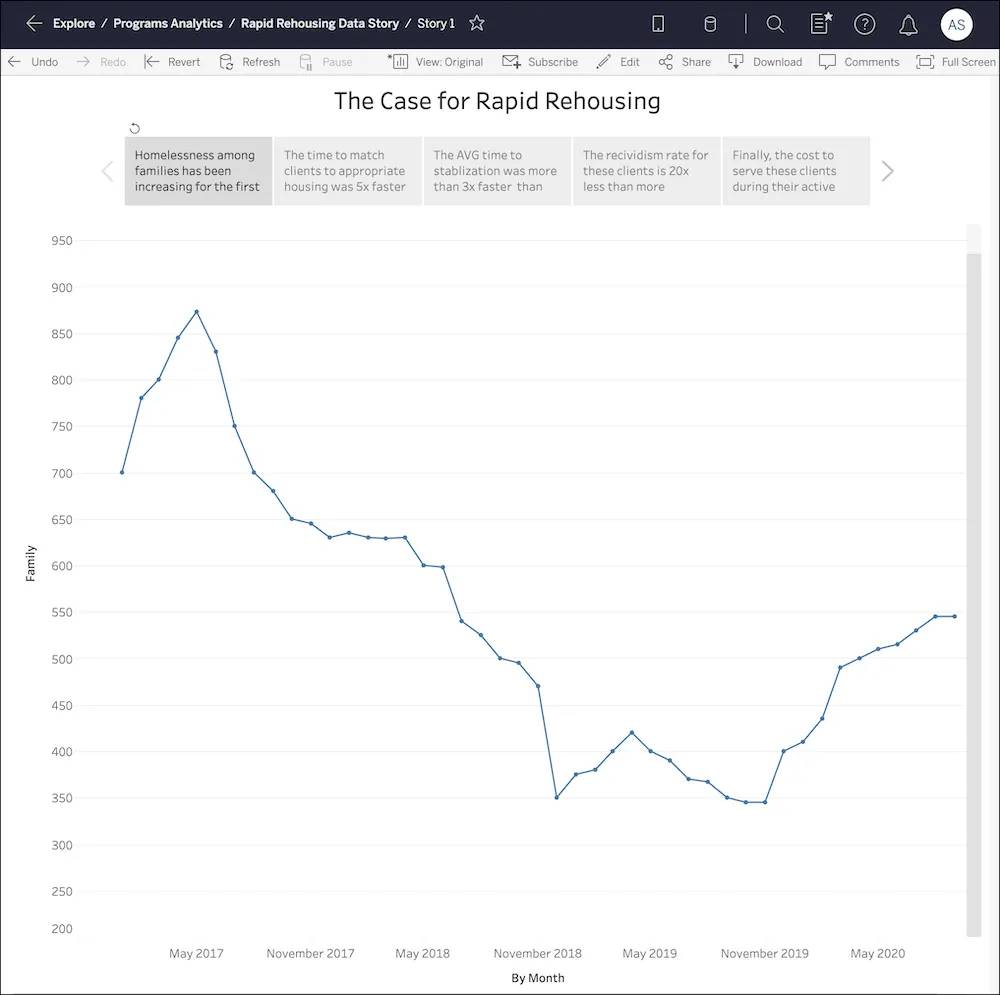
For example, NMH recently discovered that due to several health and economic events, the number of newly homeless families was starting to trend higher for the first time in a decade. With historical client data as evidence of the shift in need, the NMH Program team approached its leadership about ramping up a pilot rapid re-housing program. As it expanded the program, NMH can do real-time monitoring and quickly identify and act on opportunities to optimize its efforts. It also could share real-time results with its leadership team, board members, and potential funders.
Advocate and Educate
In addition to analyzing donor behavior and reporting on impact, NMH also uses Tableau in its work to advocate for policy solutions to end homelessness. Pairing personal client stories with corroborating data about its programs helps NMH influence policymakers and grow community support.
NMH’s rapid re-housing pilot was so effective that it shared a Tableau story—a series of visualizations arranged in sequence to tell a data narrative—with its local policymakers and community partners to advocate for additional support for its rapid re-housing efforts.
For inspiration on how to use Tableau stories in your work, check out Tableau Public, a free platform where anyone can publicly share and explore data visualizations. Using Tableau Desktop or the free Tableau Public app, you can share visualizations about any public data topic. Tableau Public is a great place to publish data on topics about the critical issues in our communities and be inspired by data enthusiasts across other industries. Check out the Nonprofit Gallery linked in the Resources section to see just a few examples of how nonprofits are telling an impact story with data.
How to Get Started with Tableau
There are two ways for nonprofits to get started with Tableau.
- Start a free trial: Every nonprofit can start a free, 14-day trial of Tableau via the Tableau website. Most people use Tableau Desktop, included as part of the Creator package, to analyze their data, though you can also do analysis on the web using Tableau Server or Tableau Cloud. We offer a variety of product and pricing options to fit organizations with different data needs, so check out the Resources section of this unit and talk to your account executive for more information.
- Purchase at a deep discount: For qualified nonprofits and non-governmental organizations (NGOs) with operating budgets under $5 million (or equivalent in local currency), you can obtain a highly discounted version of Tableau Desktop from TechSoup, a partner of the Tableau Foundation. The Tableau Foundation works to accelerate the use of data in solving the world’s biggest problems. In 2018, the Tableau Foundation announced a commitment to donate $100 million in software, training, and financial support by 2025. Check out the details in Resources.
Once you have a trial or paid licenses, you can see actionable data quickly by using one of Tableau’s prebuilt Accelerators.
You’ll learn more about the Accelerators for nonprofits in the next unit.
Resources
- Tableau Website: Products
- Tableau Website: Meet Tableau Blueprint: Your Methodology to Becoming a Data-Driven Organization
- Tableau Foundation Website: Let’s Build a Better World with Data
- Tableau Foundation Website: Make a Difference with Your Data: Donated Licenses for Small Nonprofits
- Tableau Public Website: Nonprofit Gallery
- Trailhead: Tableau Basics
- Trailhead: Tour the Tableau Environment