Make Your Dashboard Interactive
Lesson Objectives
After completing this unit, you’ll be able to:
- Describe what dashboard actions do.
- Describe the types of actions you can add to a dashboard.
- Add an action to a dashboard.
Use Actions in Tableau
You can add context and interactivity to your data by using actions. This makes your dashboards and views more dynamic and fun.
Dashboard actions are interactive elements on a dashboard that are driven from within worksheets. Tableau is always working on finding new ways for you to interact with your data, so the following list isn’t comprehensive, but here are a few of the different actions you can use today.
|
Action |
How to use it |
|---|---|
|
Filter |
Use the data from one view to filter data in another to help guide analysis. |
|
Highlight |
Call attention to marks of interest by coloring specific marks and dimming all others. |
|
URL |
Create hyperlinks to external resources, such as a web page, file, or another Tableau worksheet. |
|
Sheet |
Simplify navigation to other worksheets, dashboards, or stories. |
|
Parameter |
Let users change parameter values by directly interacting with marks on a viz. |
|
Set |
Let users change the values in a set by directly interacting with marks on a viz. |
You can add these actions to your dashboard in any order, as many times as you want.
Run an Action
Depending on how the action is created, you can run an action using one of these three methods.
- Hover–Rest the pointer over a mark in the view to run the action. This option works well for highlight and filter actions.
- Select–Click a mark in the view to run the action. This option works well for all types of actions.
- Menu–Click on a mark in the view to access the tooltip menu. Menu actions are often best for URL actions, where the user is connecting to web resources.
Add Interactivity to Your Dashboard
In the previous unit, you learned how to combine views into a dashboard. Pick up where you left off and add some actions to make the dashboard even more interactive.
Add a Filter Action to Your Dashboard
First, add a filter action so when you select a state on the map, the bar chart shows only the data for that state.
- Launch the Trailhead Simulator.
- Click Add a Filter Action to Your Dashboard.
- Click Begin.
- Click the Dashboard menu at the top, and select Actions.
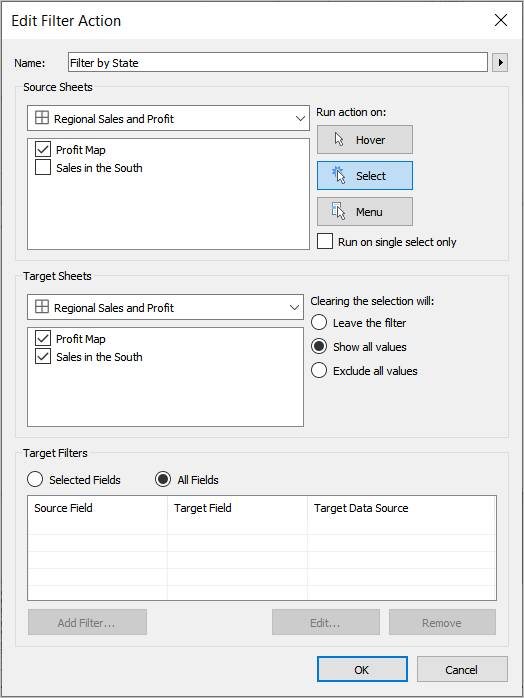
- In the Actions dialog box, click Add Action and then select Filter. Note that the Regional Sales and Profit dashboard has been selected in the Source Sheets dropdown list.
- Uncheck the Sales in the South bar chart as a source so you can drive this action using just the map.
- For Target Sheets, keep both sheets selected. This means both views will filter if you select a state in the map. Click anywhere to continue.
- It’s important to choose what clearing the selection will do. Select Show all values. This is usually the expected behavior for the end user, effectively returning the dashboard back to its default presentation.
- For Run action on, choose Select so when the user clicks on a state in the map, the bar chart will be filtered.
- You want to run the filter on all fields. So keep All Fields selected in the Target Filters section.
- Click OK to continue.
- In the Actions dialog box, click OK.
- It’s time to see the action at work. Click Tennessee in the map.
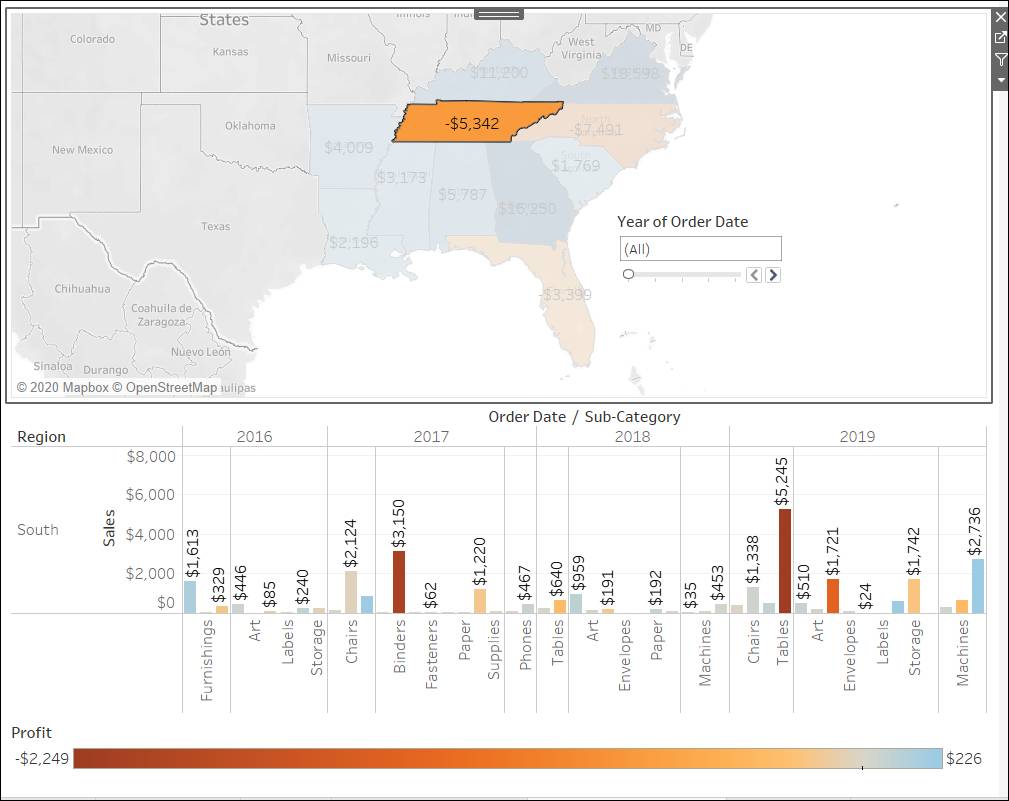 When you select a state in the map, the bar chart at the bottom automatically updates showing just the sales and profit for that state.
 - Click Next Exercise to continue to the next exercise.
Add a URL Action to Your Dashboard
URL actions create a hyperlink to a webpage or file outside of Tableau. To make the link specific to your data, you can use field names as dynamic inputs to the URL. In this example, we create a wikipedia link for each state on the map. Time to add a URL action.
- Ensure you’re in the Add a URL Action to Your Dashboard simulation. If not, launch the Trailhead Simulator and click Add a URL Action to Your Dashboard.
- Click Begin.
- Click the Dashboard menu at the top, and select Actions.
- In the Actions dialog, click Add Action and then select Go to URL.
- Name this URL action
Wikipedia forand press enter (PC) or return (Mac) on your keyboard. - Then, click the arrow to the right of the Name field for a list of available fields.
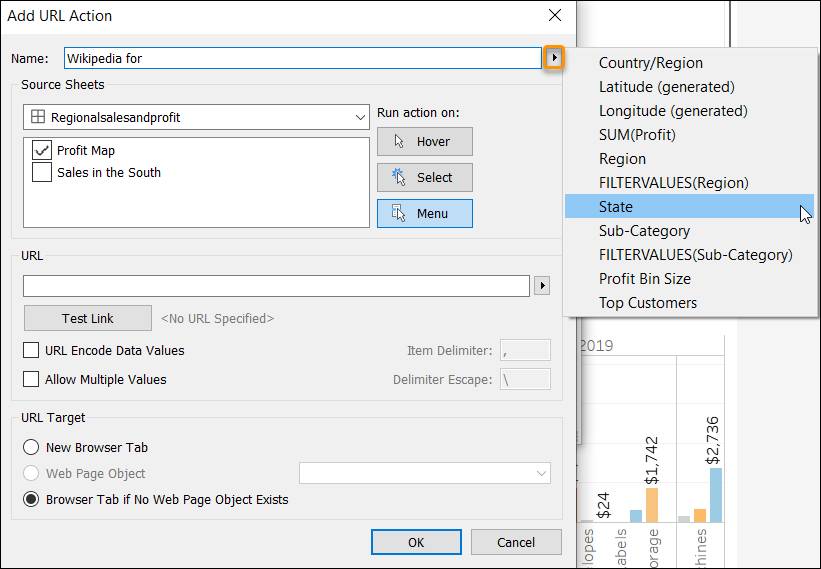
- Select State. The <State> field reference is now added.
- For source sheets, you want the URL to run from the map, so uncheck the Sales in the South bar chart. For Run action on, let’s leave it as Menu.
- The URL will be the selected state’s Wikipedia page. Earlier you looked up the format of the link. Copy the format and paste it in the URL field:
en.wikipedia.org/wiki - Then, press enter (PC) or return (Mac) on your keyboard.
- Add the state field as a dynamic input in the URL, just like with the name. Click the arrow to the right of the URL field and select State. Now when you click a state in the map, its name will be included as part of the URL.
- Click OK, and then click OK again to close the Actions dialog.
- Time to test it out. On the map, select Florida. Right in the tooltip, you can see a link to the Wikipedia page for Florida. Very cool!
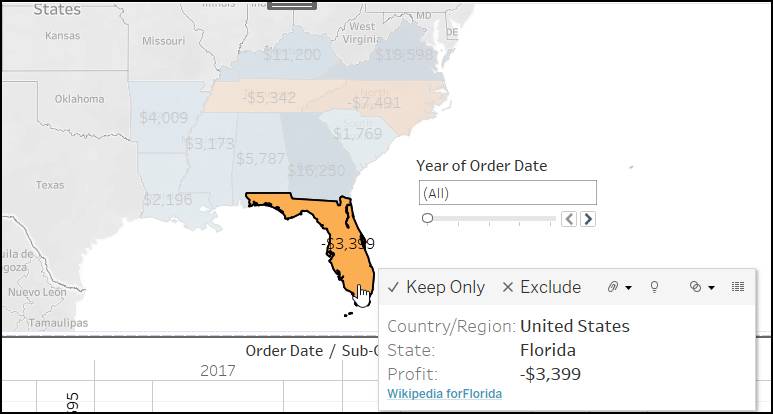
- Click Home to restart the activity or Exit to continue.
Your analysis work is complete! It’s time to put together a presentation to share your findings.