Build Charts
Learning Objectives
After completing this unit, you'll be able to:
- Explain the different ways you can start to build a view.
- Create a line chart to see trends over time.
- Create a bar chart to compare data across categories.
Before You Start
Before you continue with this module, make sure you complete Data Connection in Tableau Desktop. The work you do here builds on the concepts you learn in that module.
What Do You Want to Know?
Tableau is all about helping you answer questions about your data. Every view that you build should start with questions such as What do I want to know about my data? and Which is the best type of chart for my analysis?
Back in Data Connection in Tableau Desktop, your manager asked you to start digging into your company’s sales and order data to find areas where you can improve. You started pulling that data into Tableau. Now, with 4 years’ worth of data, it’s time to drill in to see what you can find.
As an option, you can follow along using the Superstore data source found in the Tableau Desktop free trial. We won't test you on it, but it can help illustrate the experience we talk about here. Note, the free trial can take a few minutes to download and only lasts for a limited number of days.
Later in this module, you use the simulator to familiarize yourself more with Tableau Desktop.
Where to Start?
There are a few ways to begin building a view, using fields from the Data pane.
- Drag or double-click fields from the Data pane onto shelves, such as Columns and Rows (1), or cards, such as the Filters card (2).
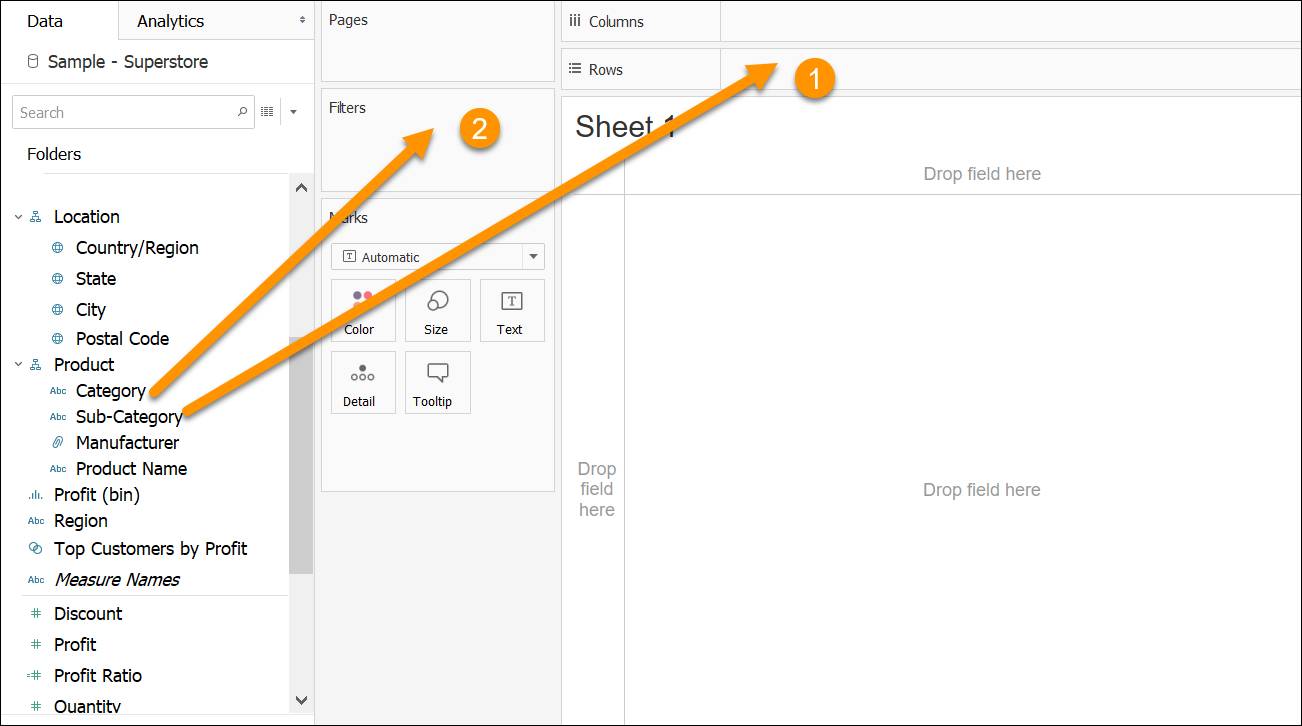
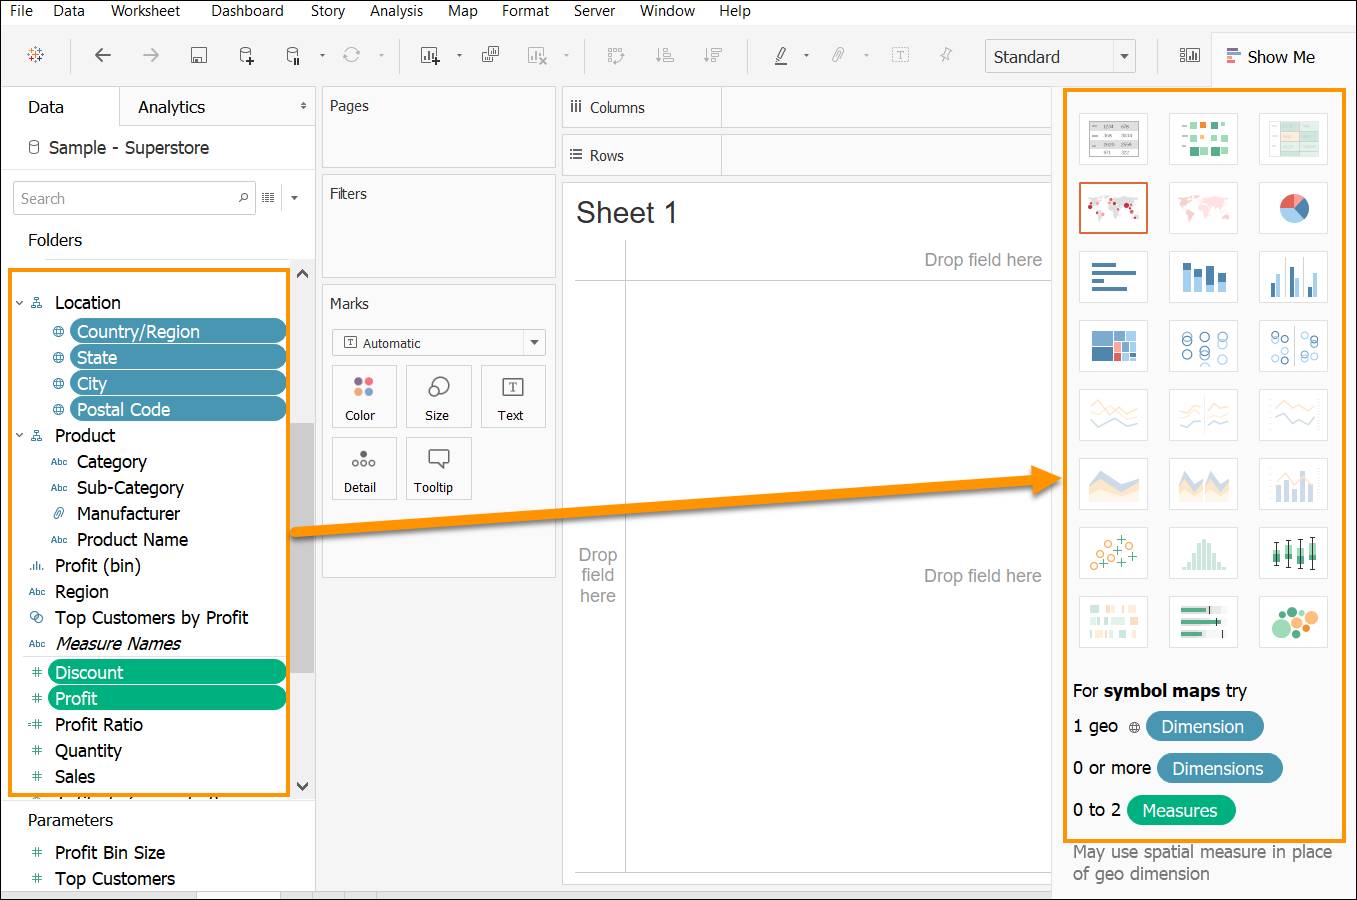
- Select one or more fields in the Data pane, and then choose a chart type from Show Me, which suggests the chart types that are appropriate for the fields you selected.
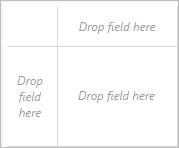
- Drag a field to the Drop field here grid, to start creating a view from a tabular perspective.
Every time you add a field, you’re asking a new question about the data. The question varies depending on where you drag the field, the types of fields, and the order in which you drag them into the view. For every question you ask, the viz changes to represent the answer visually.
Now that you know how to start building a view, let’s learn how to build the first of a couple common chart types, starting with a line chart.
Build a Line Chart to See Trends Over Time
Line charts connect individual data points and provide a simple way to visualize a sequence of values. These are handy when you want to see trends over time.
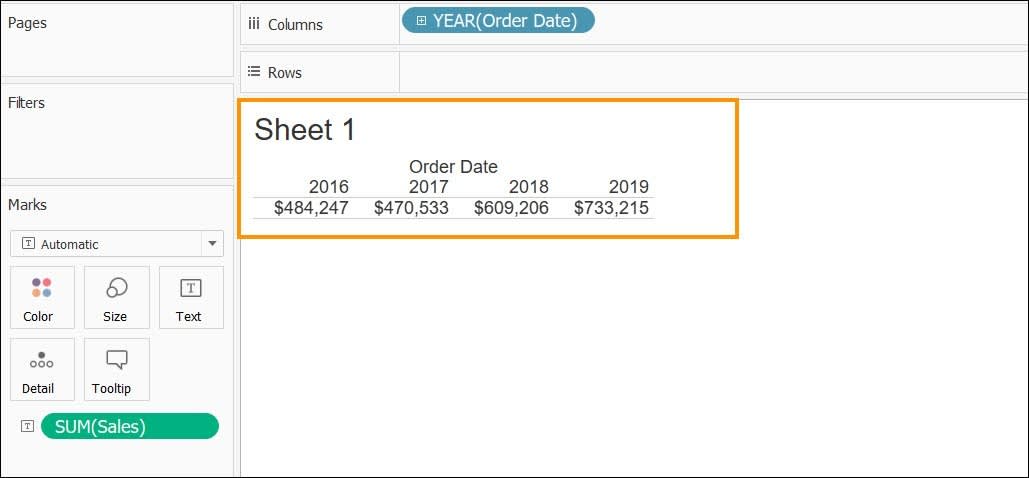
To create a line chart, you drag a dimension to the Columns shelf. When you do this, Tableau creates a column for each row in your data set. In this example, there’s a column for each year of Orders.
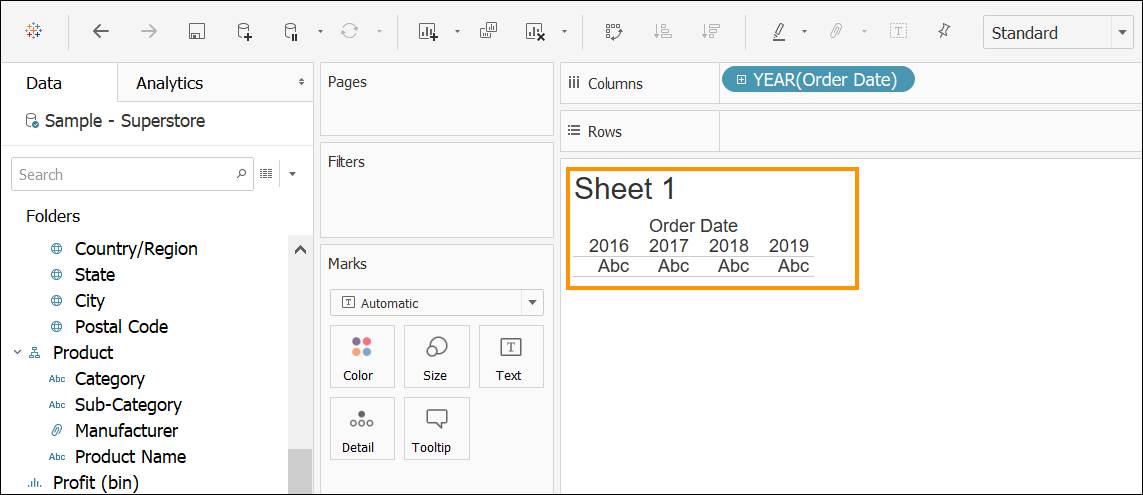
Under each year column is an Abc indicator. This indicates that you can drag text or numerical data here. So, for example, if you drag the Sales measure to this area, Tableau creates a crosstab, like a text table, and displays the sales totals for each year.
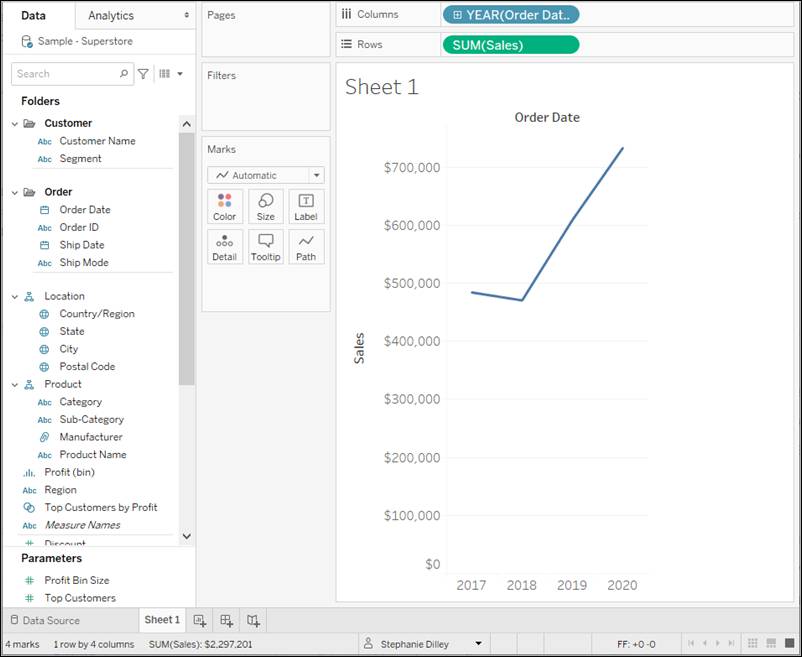
So, where does the line chart come in? Drag the Sales measure to the Rows shelf and see that Tableau automatically generates a line chart.
The line chart will show total aggregated sales for each year by order date.
Wait a second, what is aggregation? In short, aggregation is simply a calculation on a set of values that returns a single value, such as a sum or average. For more information on aggregation, check out this blog post.
This line chart shows that after a dip, sales increased over time, starting in 2018. This is good information, but it doesn't really tell you much about each product and if there are some products that are performing better than others. Explore the data further to see what else you can find out.
Build a Bar Chart to Compare Categories
To gain more insight, try adding more data and build a bar chart. In this example, the Product category is added to the Columns shelf to the right of YEAR(Order Date). The view automatically updates to a bar chart.
By adding a second dimension that is not a date field to the view, you can categorize your data into discrete chunks. This automatically creates a bar chart. The new visualization shows overall sales for each product category by year.
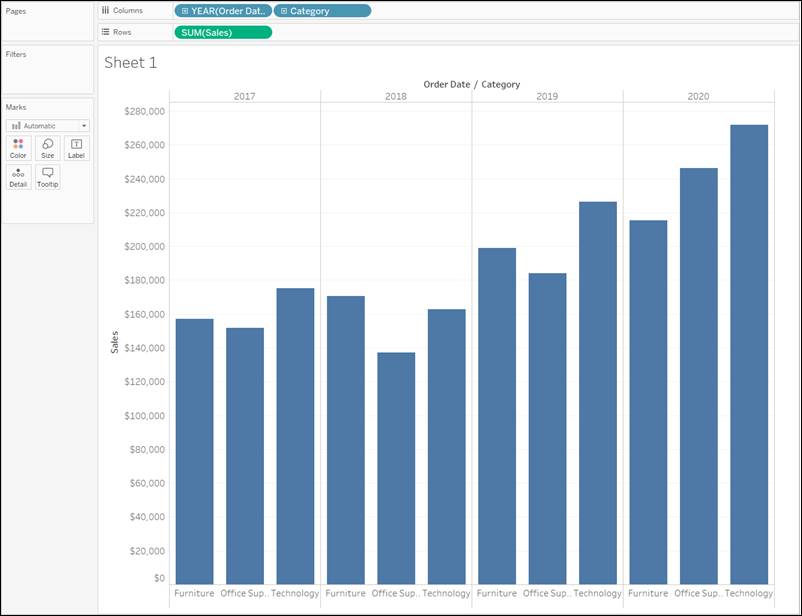
This is closer to the type of data you want to investigate. The Category field shows sales by category—furniture, office supplies, and technology—and the bar chart allows you to compare them. You just revealed some key insights.
From this view, you can see that sales for furniture is growing faster than sales for office supplies, even though office supplies had a really good year last year. Perhaps you can recommend that your company focus sales efforts on furniture instead of office supplies?
But, your company sells a lot of different products in those categories, so you need more information before you can make a recommendation.
Add More Insight Into Your Bar Chart
To help get more information, add Sub-Category to the view and see which items are the big sellers.

Sub-Category is another discrete field. It creates a new header at the bottom of the view, and shows a bar for each subcategory of the product (68 marks or points where your data intersects, to be precise), broken down by category and year.
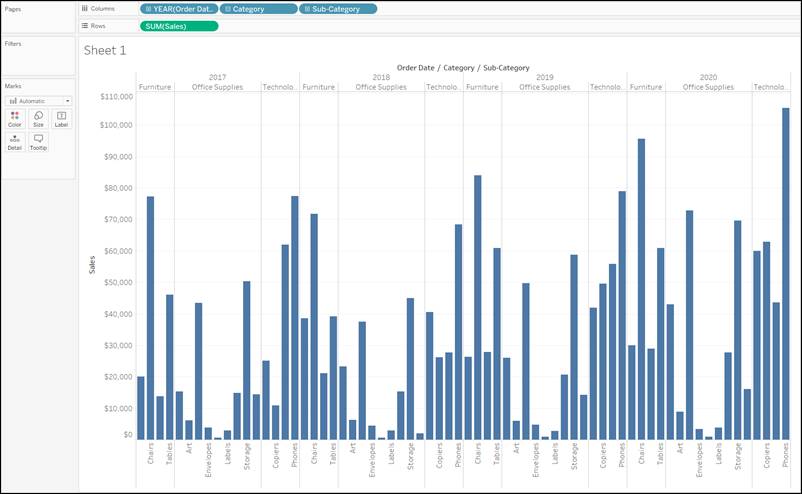
Now you are getting somewhere, but this is a lot of data to sort through. Next, you learn how to build a couple other kinds of views, as well as how to add color, filters, and more, to focus on specific results.