Create UX Artifacts
Learning Objectives
After completing this unit, you’ll be able to:
- List the two main categories of UX artifacts.
- Describe the processes for creating UX artifacts.
- Explain why prototypes are useful.
When you and your stakeholders have a shared understanding of the project goals, it’s time to start the design process. Depending on your goals and methods, there are many different types of artifacts to design. Design processes are cyclical and reliant on periodic stakeholder and user feedback through multiple iterations of your design. Feedback should be reflected in each round of design revisions until your stakeholders and users are satisfied with the user experience.
In UX design, you design a solution to a problem. The outcome isn’t always a breathtaking visual design. Sometimes it’s a diagram documenting a process or words on a page describing a product vision. Other times it’s requirements, specifications, prototypes, research readouts, and high-fidelity designs. This unit covers UX deliverables and the tools you can use to create design solutions.
UX Artifacts
As part of the design process, you create different types of deliverables. We’ve covered design briefs, personas, and Jobs to Be Done. This unit introduces the UX artifact. UX artifacts are craft-based deliverables, such as sketches, shapes, compositions, and interactions. They are outcomes of the design process. There are two main categories of UX artifacts: mapping and screens.
Mapping
Map-type UX artifacts are diagrammatic representations of a user’s experience. UX mapping helps designers and stakeholders empathize with the user, understand friction points, and identify opportunities for improvement. Mapping exercises and artifacts encourage people to approach problem-solving from a user-centered perspective.
Similar to land maps, UX maps can include a broad view of the whole experience, as a world map would, or they can zoom in to a specific step in an experience, like a city map. You gather the information needed to create a UX map by holding workshops and talking with users. Maps, and the input required to complete the maps, are forms of research.

UX artifacts are critical to understanding the people who use your product or service. The more you know about the users, the better equipped you are to create a solution that works best for them. These maps can help you understand your users better.
Journey map: A journey map is a visualization of each step of a persona’s experience with a product or service over a period of time. This map helps you tell the story of a user’s interaction across all touchpoints. Talk to users to piece together their journey, and sometimes you find that their actual journey is not the same as you thought it was. Use a journey map to identify process optimizations, pain points, and potential solutions for the pain points.
Service blueprint: A service blueprint extends a journey map by diagramming the before and after states. While a journey map focuses on interaction while using a product or service, a service blueprint shows what happens before and after using the product or service. Service blueprints go a bit deeper than journey maps and establish relationships between digital and physical interactions. These maps help you understand the complete lifecycle of user interaction.
Ecosystem map: An ecosystem map helps visualize complex relationships among multiple systems. This map can be a doozy in enterprise businesses that rely on interdependent applications that share data through a series of touchpoints. Ecosystem maps aren't just for technology. They include information, services, channels, and even people. They also include social systems when teams of people work together toward a common goal. For instance, consider a legal contract: the buyer, seller, finance office, and management folks are all involved in negotiating, editing, and approving the agreement. Ecosystem maps help you understand complicated environments and how users interact with them.
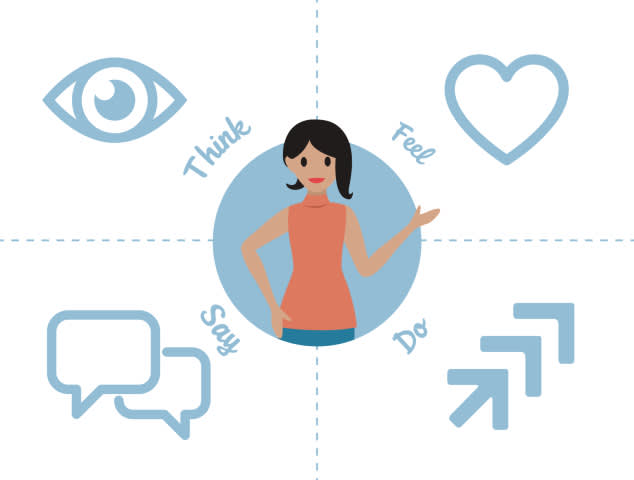
Empathy map: An empathy map is a visualization of how a user thinks, feels, acts, and speaks. This type of map helps you consider user psychology and identify the motivations behind your product or service's persona. Create an empathy map for each persona. They are square with four equal quadrants.
- Say: The Say quadrant holds direct quotes from user interviews.
- Think: The Think quadrant lists things that matter to the persona and things they think about when using your product or service.
- Feel: The Feel quadrant describes the emotional state of the persona from excitement to frustrations.
- Do: The Do quadrant lists actions a user takes while interacting with your product or service.
Together, the contents of the four quadrants helps you understand and empathize with your persona.
Mental model: A mental model is an interaction pattern in your brain. It represents how you think a system should work. Mental models are used in web and application design to build functionality that users learn to use easily because it parallels something they’re already familiar with. One famous example is the shopping cart icon on ecommerce websites. When you shop online, you don’t need a physical shopping cart as you do at a grocery or department store; however, your mental model of a physical shopping cart is the basis for how you expect the online shopping cart to work. Mental model maps are an outcome of user research that lists users' common mental models for a given experience. Use mental models to inform your design concepts.
Storyboard: A storyboard is a sequence of illustrations that helps designers and stakeholders visualize how users interact with your product or service at each stage of their journey. Storyboards are similar to little comic strips that help you and your stakeholders empathize with users. Storyboards don’t have to be perfect illustrations. Collect data through research and ideation. Use that data to inform your storyboard and align with your stakeholders on a shared understanding of users’ experience with your product or service.
Screens
After creating UX artifacts to empathize with users, identify pain points, and align with your stakeholders, it's time to continue the UX journey by designing screens for your product or service.
“Good design, when it’s done well, becomes invisible. It’s only when it’s done poorly that we notice it.”
—Jared Spool, Usability Writer and Educator
When you start designing screens, focus on information hierarchy, the appropriate positioning of design elements. On each screen, position the most critical data and actions prominently in highly visible areas. Put secondary and tertiary information in less prominent areas of your design. Use intuitive titles and content grouping to help users find what they need. Fine-tune your information hierarchy by sharing your screen designs with users early and often.
In early phases, you experiment and refine your design continually based on user feedback. Use low-fidelity sketches so you can evolve your design quickly. You don’t need a vector drawing tool; you can design using code and design systems too.
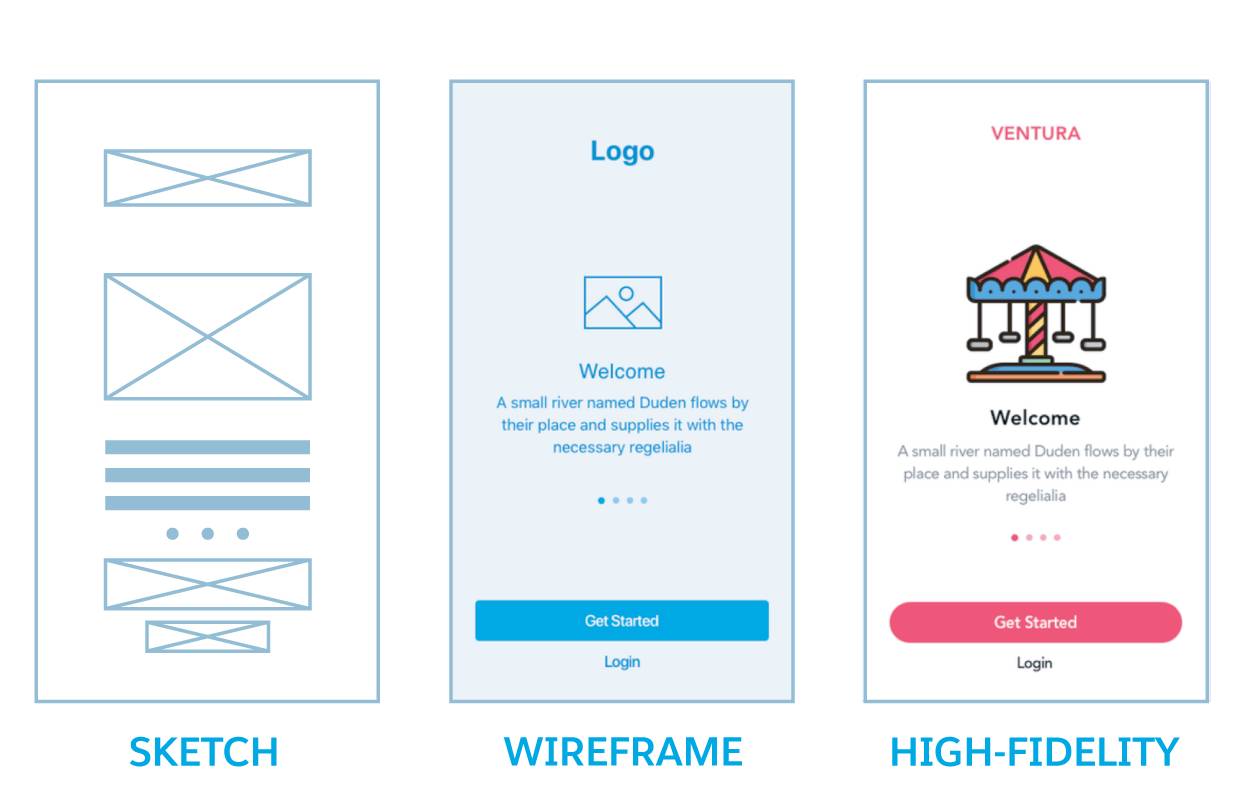
As your design matures, use wireframes to share the design with users. Their feedback helps you identify areas of your design that are rock-solid and others that may need more work. When you've received enough feedback to feel confident that an area of your design is rock-solid, create a high-fidelity screen for it.
Save the high-fidelity screens for last because making them is time-consuming. High-fidelity designs are what you deliver to engineering partners. Because engineering will build the design exactly as seen in your screen mockups, the high-fidelity screens should be pixel perfect.
Prototypes
Regardless of fidelity, there are a few ways to share your designed screens with users and stakeholders. Just showing static screens is fine, but the downside is that they’re, well, static. They don’t accurately represent the user’s interactions with your app. Prototypes bring static screens closer to reality.
The goal of a prototype is to convey the interaction to the user. The more interaction a design has, the more complicated and time-consuming the prototype can be. Screen design is fastest and easiest in low fidelity. The same is true of prototypes. A click-through prototype, using tools such as Google slides or InVision, is a quick way to get early feedback. Coding prototypes are the closest you can get to a real app, but the time needed to build them delays early feedback.
Design deliverables range from sketches to diagrams to fully functional applications. Each deliverable is rooted in feedback from the people who will use your product or service. The design tool market is booming with new tools to help you quickly get designs in front of users for feedback. Depending on your goals and constraints, choose UX artifacts that will help you build a successful product or service.