Get to Know Tableau
Learning Objectives
After completing this unit, you'll be able to:
- Describe how to use Tableau for analysis and collaboration.
- Explain how Tableau helps you move fast from data to insights.
Gain Insights from Your Data
Your manager has asked you to look into the overall sales and profitability of your company and to identify key areas of growth and improvement. You have your data, but you aren’t sure where to start. Not to worry—Tableau is an end-to-end analytical product suite that can help you every step of the way—from preparing your data to turning it into useful, actionable insights you can share with your manager and broader team. Here's how.
Prepare Your Data Source
Get your data ready for analysis by using Tableau Prep. You have a bunch of data, but it exists in various places and forms. You don't have to learn a complicated tool or know how to code to combine, clean, and prepare your data. By offering a visual and direct way to combine, shape, and clean data, Tableau Prep Builder makes it easier for you to prepare your data source for the next step: analysis.
Here’s a quick summary of how Tableau Prep fits into the data analysis cycle.
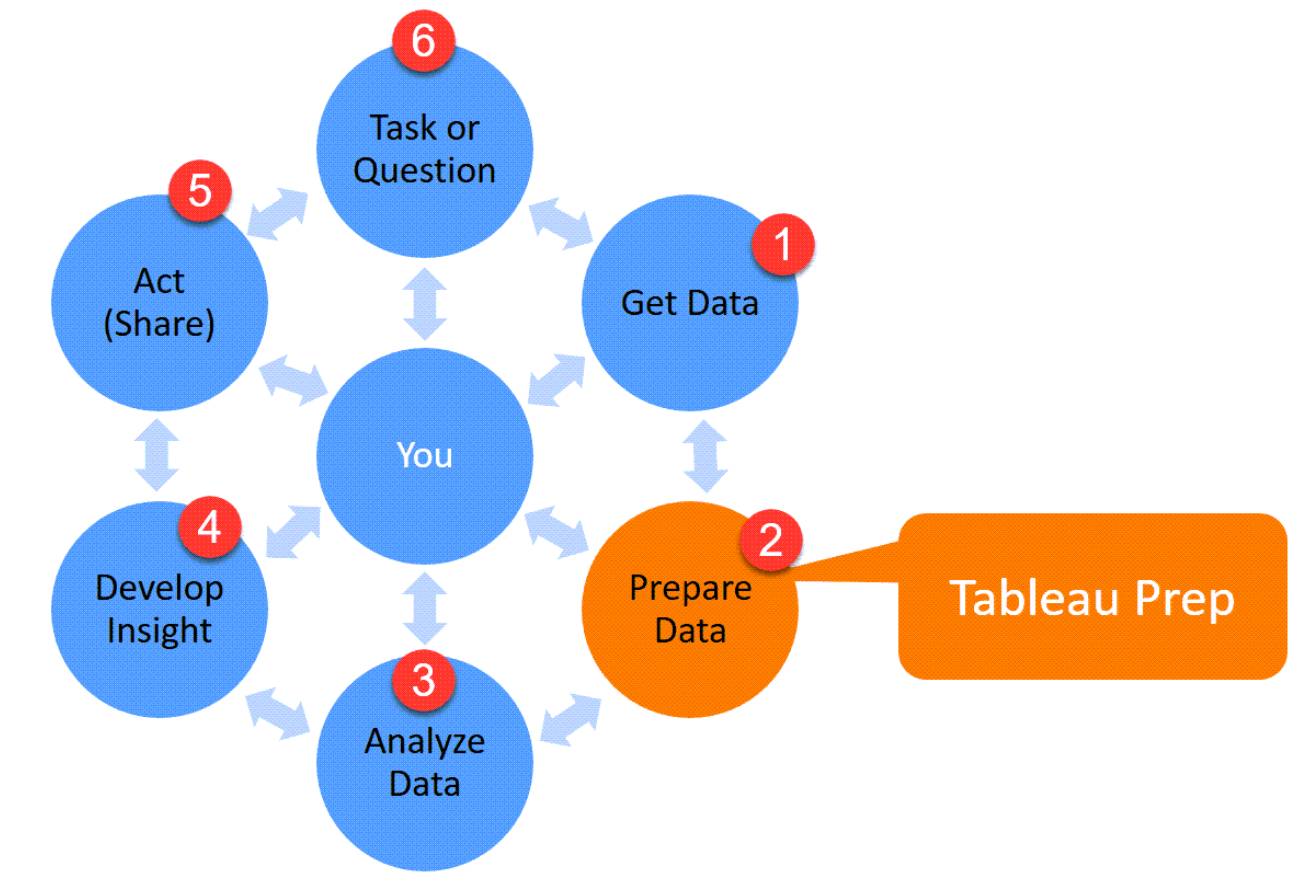
- Get Data: Obtain or get access to the data that you need.
- Prepare Data: Clean, shape, and combine the data with other data. This is where Tableau Prep Builder fits into the process.
- Analyze Data: Analyze the data visually by creating the charts you need.
- Develop Insight: Gain the understanding you need.
- Act (Share): Make data-driven decisions using the answer you have visualized and the understanding you have gained. Share or present your work to others.
- Task or Question: What specific question are you trying to answer? The question could be your own or requested as a task by someone else.
Analyze Your Data
Most people use Tableau Desktop to analyze their data, though you can also do analysis on the web using Tableau Server or Tableau Cloud. Tableau Desktop has the richest range of features for analyzing data, providing an intuitive interface that allows you to visualize your data and answer questions through analysis.
From Tableau Desktop, you can connect to a vast variety of data sources, wherever they are. Also, from Desktop, you can publish data sources for sharing on Tableau Server or Tableau Cloud. If you want to share views and dashboards locally, share workbook files saved in Tableau Desktop.
Publish Your Data
You’ve connected to a data source and analyzed the data. Now you’re ready to share your insights. Tableau offers a few different tools you can use to do that.
Tableau Server is an enterprise scale solution for easily managing and sharing data and insights. Tableau Server is typically managed by your IT department and can be deployed on-premises or in the public cloud.
Tableau Cloud is similar to Tableau Server, but without the additional burden of managing a server or infrastructure. Tableau Cloud is hosted in the cloud, and Tableau does all the infrastructure and maintenance for you. You don’t have to configure servers, manage software upgrades, or scale hardware capacity.
Tableau Public is a free service that lets anyone share Tableau visualizations on the web. For enterprise sharing or if using sensitive data, this isn’t the platform for you. But for everything else (statistics about your favorite sports team? restaurant reviews? crime stats?), go right ahead!
You now know about the different Tableau products and how you can use them to become a data rockstar!