Connect to Your Data in Tableau Desktop
Learning Objectives
After completing this unit, you’ll be able to:
- Connect to your data.
- Describe how you can modify your data on the Data Source page.
- Edit data fields.
The Start Page
First things first. When you open a new instance of Tableau Desktop, you see the Start page. If you already have Tableau Desktop open, you can navigate to the Start page by clicking the Tableau icon ![]() in the upper-left corner of the Tableau Desktop workspace.
in the upper-left corner of the Tableau Desktop workspace.
This is where you connect to your data from Tableau Desktop.
Learn more about the Start page by watching this video:
The Data Source Page
You've connected to your data and are now ready to create a view… maybe. Often, data needs some preparation or modification before you start your analysis—you might want to add another table to your data, you might need to rename a column, or you might need to modify a data type.
You can do all of these things (and more) to prep your data for analysis on the data source page. The configurations that you make on this page create the data source that Tableau uses to interpret and interact with your data. Some of the data preparation tasks you can do on this page are:
- Renaming your data source
- Cleaning data using Data Interpreter, depending on the source of your data
- Setting options for text files
- Combining tables for analysis using relationships, joins, or unions
- Editing data columns
- Changing data types
When you’re knee-deep in analysis and decide you want to make changes to the Tableau data source, just click the Data Source tab from any location in the workbook.

Parts of the Data Source Page
After you connect to your data, the data source page displays. Although the look of the page and the options available vary depending on the type of data that you’re connected to, the data source page typically consists of four main areas: left pane (1), canvas (2), data grid (3), and metadata grid (4).

Left Pane
The left pane of the data source page displays details about your data—the data that Tableau is connected to.
- For file-based data, the left pane might display the file name and the worksheets in the file.
- For relational-based data, the left pane might display the server, the database or schema, and the tables in the database.
You can also use the left pane to add more connections to the data source to combine columns from tables in different databases using a cross-database join.
Canvas
The content in the canvas depends on the type of data you connect to.
- For most relational and file-based data, you can drag one or more tables to the canvas area to set up your Tableau data source. Tables can be from the same or multiple data sources.
- For cube data, the top of the data source page shows the available catalog or queries and cubes to select from to set up your Tableau data source.
The top-level canvas is the Relationships canvas. Double-clicking a table here opens the Joins canvas.
When you’re connected to an extract (a snapshot in time) of your data, you can get the latest data by clicking Refresh next to the Connection area in the upper-right side of the canvas.
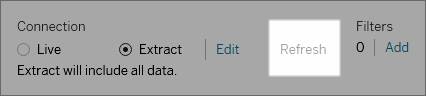
For more information, see Refresh Data Sources, Refresh Extracts, and Extract Your Data.
Data Grid
Use the data grid to review the fields and the first 1,000 rows of the data contained in the Tableau data source. You can also use the data grid to make general modifications to the Tableau data source like sorting or hiding fields, reviewing or renaming fields, creating calculated fields, changing data types, changing the column or row sort, or adding aliases.
In the Relationships canvas, the data grid shows data specific to the selected table. In the Joins canvas, the data grid shows merged data for any joined or unioned tables. Column data can be pivoted only in the Joins canvas.
The data grid isn’t displayed for cube (multidimensional) data.
Metadata Grid
Depending on the type of data you’re connected to, click the metadata grid button to switch to the grid view. The metadata grid displays the fields in your data source as rows so you can quickly see the structure of your Tableau data source and perform routine management tasks, such as renaming fields or hiding multiple fields at once.
The metadata grid displays by default when you connect to cube data or some extract-only data.
When your data is ready for analysis, click Sheet 1 at the bottom of the screen to open the Tableau workspace and build a view.
To learn more about the data source page, take a look at this video where we connect to Superstore order data.
As you can see, connecting to your data in Tableau is easy!
Resources
- Tableau Help: Connect to Your Data
- Template: Customize the Discover Pane (GitHub)
- Tutorial Video: Relationships (Sign-up required)
- Tableau Help: Refresh Data Sources
- Tableau Help: Refresh Extracts
- Tableau Help: Extract Your Data
- Tableau Help: Prepare Data on the Web