Create Vision and Value Maps
Learning Objectives
After completing this unit, you’ll be able to:
- Describe the value of Vision and Value Maps.
- Explain how to construct Vision and Value Maps.
Finish Strong
Okay, so you’ve interviewed your key stakeholders and synthesized your core learnings. Now you’re ready to create the final pieces of the puzzle that will make a strong case for your investment in digital transformation. There, we said it: digital transformation.
While digital transformation is a bit of a buzzword, it does convey how your organization will integrate all of your critical organizational systems—from the way you store donor information to how you deliver programs and manage payroll–into a cohesive, digital ecosystem.
For many nonprofits, just the idea of digital transformation can feel daunting; however, now more than ever, nonprofits have to be hyper-focused on efficiency and delivering the highest levels of impact to justify the funding needed to effectively meet their missions.
If you’ve been following the suggested planning process we outlined in Units 1 and 2, the work you’ve done so far will help you articulate a vision for at least some part of a digital transformation at your organization. Taking the next step–creating Vision and Value Maps–will help connect your vision to technical solutions and illustrate the potential impact of a digital transformation.
Create a Vision Map
Why a Vision Map? A Vision Map is a simple visual model, organized by how your nonprofit engages with your stakeholders, of why your organization needs to invest in new technology. It can be incredibly useful in helping Board Members, executives, potential donors, and staff internalize your vision and become the change champions you’ll need for long-term adoption and success.
In your stakeholder interviews, you learned about the “ideal experience” that your organization would like to provide for the people you serve, donors, volunteers, corporate partners, and others. Using that information, along with the goals and opportunities that your interviewees described, you can create a visual guide of all the ways your organization would like to interact with your core stakeholders.
Let's take a quick look at an example from our fictional nonprofit, No More Homelessness. They have chosen six areas of focus and filled in corresponding details:
Seamless Client Experience
High quality experiences across digital and in-person interactions that exceed clients’ expectations and deliver the resources they need–made possible by a single source of truth for all client information.
Self-Service Volunteering
Self-service online portal for volunteers to easily manage shifts, access training, and communicate with staff so they can focus more of their volunteer time on serving clients.
Personalized Engagement
Communications and recommendations tailored to each client’s situation and needs, delivered at scale.
Sense of Community
Clients feel understood, cared for, and appreciated because staff always know their story and background via sharing and collaboration tools.
Mobile Intake
Clients can quickly access services anywhere, thanks to apps that are mobile first and easy for staff members to use on phones or tablets in the field.
Strategic Insights
Actionable analytics help program managers, executive team members, and staff to make data-driven decisions that improve the client experience.

Ultimately, Allyson and the NMH Executive team will use this Vision Map to create better alignment and understanding across teams and increase collaboration as the organization dives into implementation and adoption of their new technology.
Show Potential ROI with a Value Map
Along with this Vision Map, Allyson will add one more critical piece to her Salesforce plan by creating a Value Map. A Value Map is how you show the potential return on your technology investment. This is where you really make the case for change.
Using a basic data table, Allyson will show how Agentforce Nonprofit will help meet NMH’s key organizational objectives and how meeting those objectives could lead to greater impact and real results. NMH’s Board is wary of any significant investments in technology, but Allyson believes that a Value Map will help make clear the potential impact of a transformative tool like Salesforce.
Build a Value Map
Allyson builds her Value Map in three steps:
-
Goals & Objectives. Identify the most important goals (about 3 to 4) that your organization wants to achieve. Choose the goals that had consensus among multiple leaders–not goals that were only mentioned by one person.
-
Key Capabilities & Features. Identify the capabilities that Salesforce will enable to meet your organization’s needs, compared to your current processes today. If you need help describing Agentforce Nonprofit's capabilities, check out the Salesforce website.
-
Impact & Metrics. Map organizational impact and metrics to the capabilities and features identified. Allyson uses back-of-the-napkin calculations based on NMH’s annual budget as well as current metrics to show sensible projections based on real data.
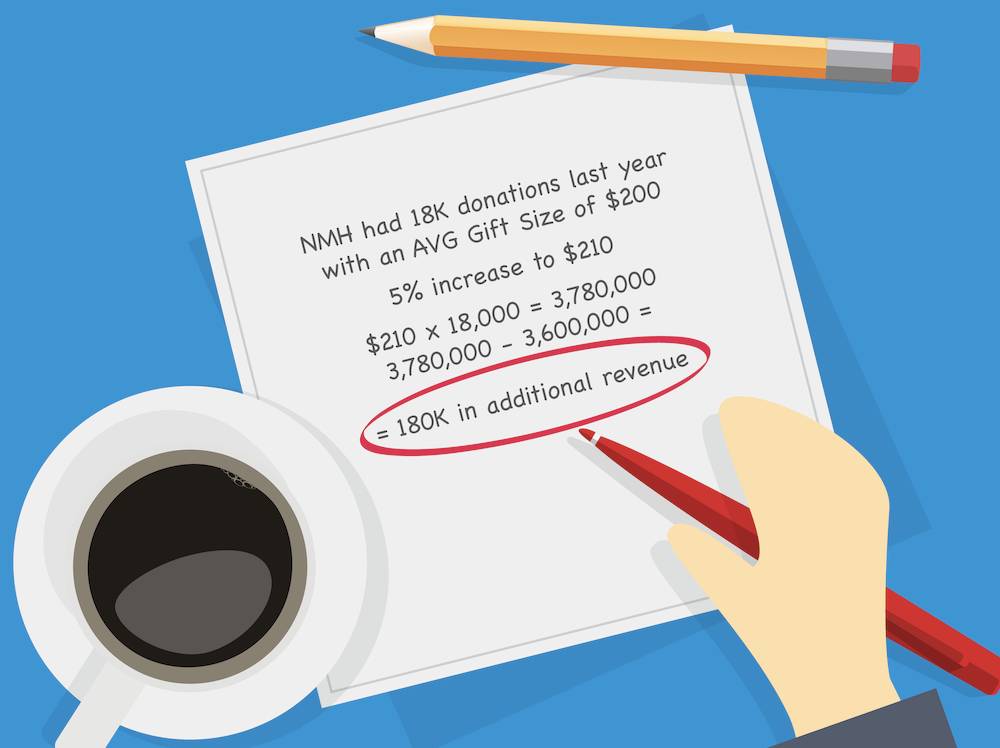

Seeing the potential increase in impact, reduction in service costs, efficiency gains, and improved experience as real numbers can really help get your teams energized around your project. If your organization hasn’t been tracking some of this data, you can also use industry data to help them imagine what might be possible. See the Resources section of this unit for data from our Voice of the Customer survey, one potential source for industry data.
Whew, now Allyson is ready for a snack. Before she decides what to eat, she’ll just jot down a vision for her snack experience… Wait, maybe that’s going a bit too far! Okay, we know it might feel like you’re doing a lot of work for a project where the hands-on implementation hasn’t even begun, but this foundational planning is absolutely vital to getting your organization a full return on its investment. If it helps, you started down the path to implementation success the minute you started reading this trail. Now let’s keep going. Next up is understanding more about the voyage to long-term adoption and success.
Resources
- Template: Vision Map and Path to Value Templates (Download)
- PDF: Voice of the Customer NGO
- Salesforce Help: NPSP Feature Configuration Overview