Use Breakpoints
Learning Objectives
After completing this unit, you'll be able to:
- Execute breakpoints.
- Manage breakpoints.
If you've ever needed to pause your JavaScript code midstream to see what was happening, then you've probably used the debugger command. And after you solved the problem, you had to remove the debugger command before pushing the code to production. Although there are times when the debugger command is necessary, there is a better way to get your code to pause. Add breakpoints in DevTools while you're viewing the page in the browser. Breakpoints are easier to set and they don't require code cleanup after using them.
Follow Along with Trail Together
Want to follow along with experts as you work through this step? Take a look at this video, part of the Trail Together series on Trailhead Live.
(This clip starts at the 26:18 minute mark, in case you want to rewind and watch the beginning of the step again.)
Breakpoints
Breakpoints allow you to pause the JavaScript. While the code is paused, you can view the state of variables and the conditions of your code. There are several types of breakpoints.
Line-of-Code Breakpoints
Line-of-code breakpoints are great when you want to investigate a specific section of code. Let's add a breakpoint that pauses before a selected line of code is executed.
Having completed the previous unit, you should already have display.js open in the Code Editor. If not, follow the instructions in the Locate the Lightning Web Components section of the previous unit now.
- In the DevTools Code Editor, find the
handleIncrement(event)function.
- Click the line number for
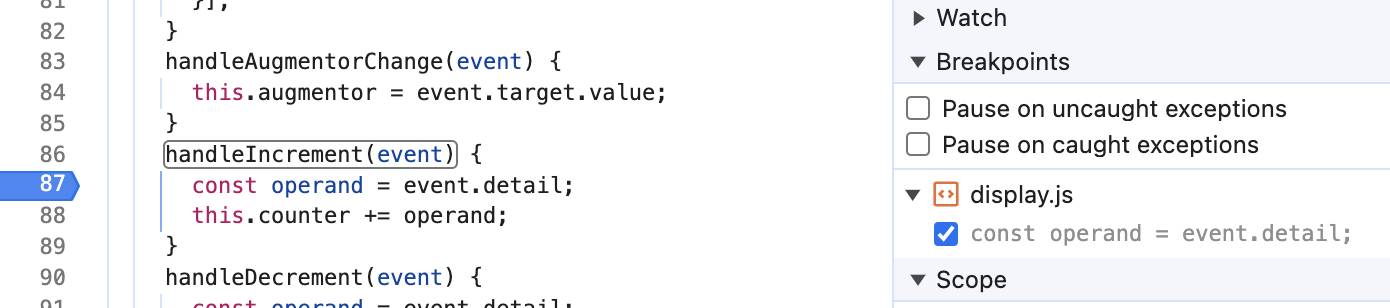
const operand = event.detail;inside the handleIncrement function. A blue pointer highlights the line number to indicate that a breakpoint is set on that line.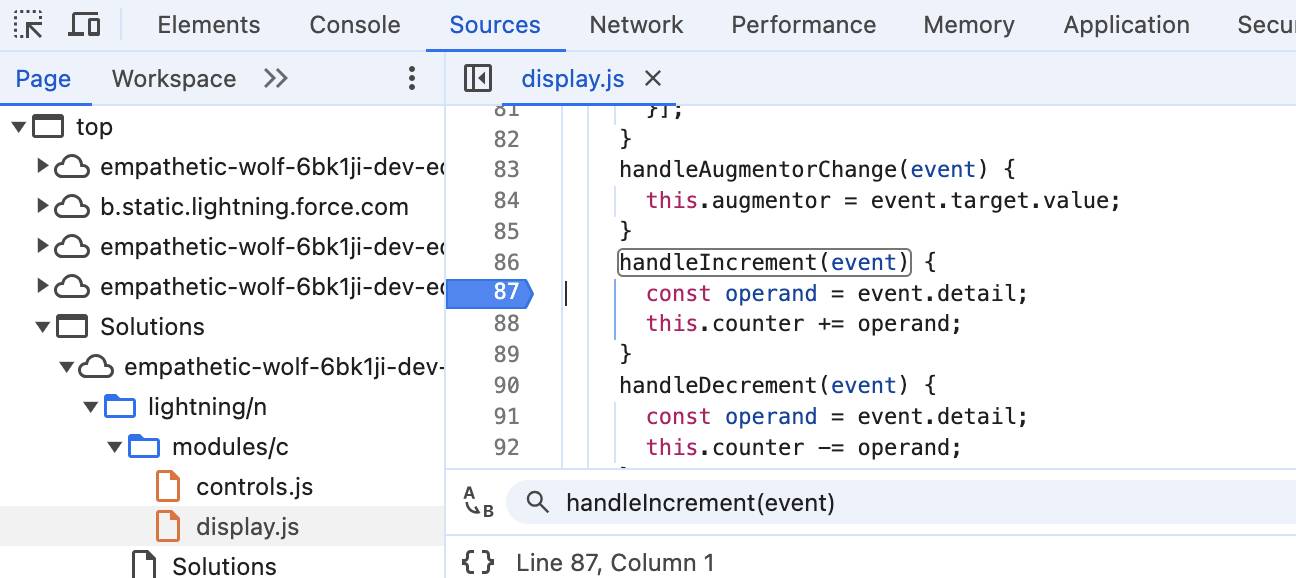
- The breakpoint is also shown under Breakpoints in the JavaScript Debugging pane on the right.
- Click +1 in the Solutions app. Code execution pauses at the breakpoint.
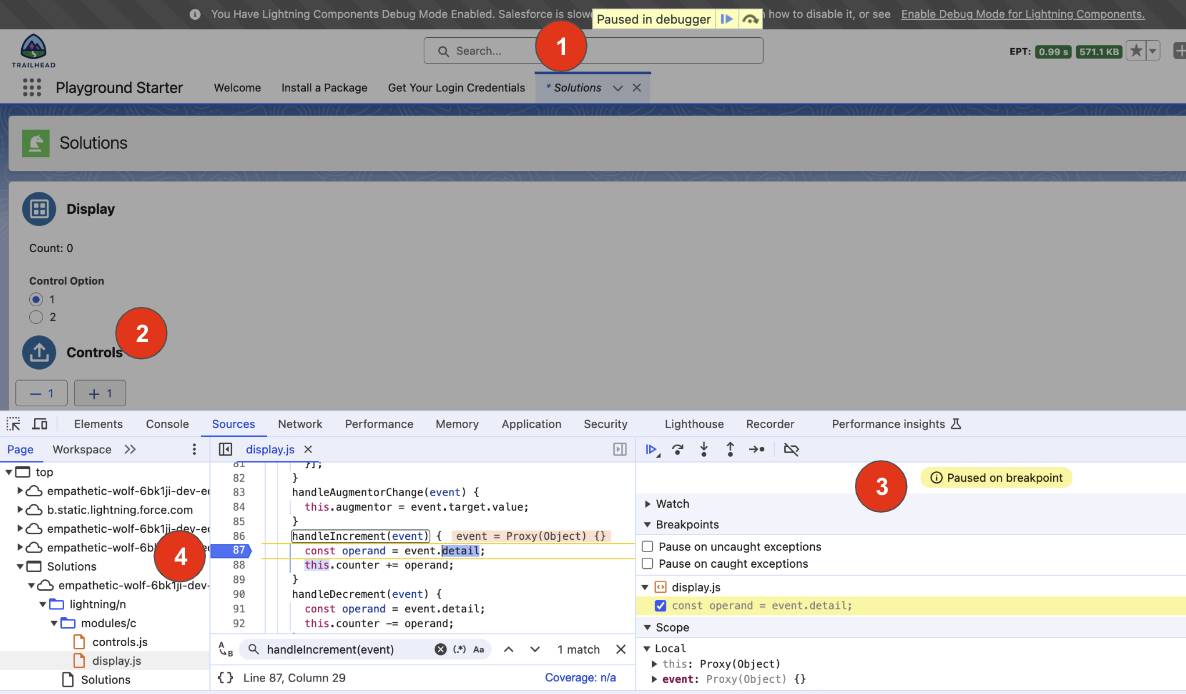
Notice the Paused in debugger indicator (1). The +1 button (2) is in the clicked state. The Breakpoint control toolbar (3) indicates Paused on breakpoint. The blue arrow icon indicates that the debugger stopped at the handleIncrement function. The line with the breakpoint is highlighted (4), showing where the debugger paused at the breakpoint.
Navigating Breakpoints
Now that the code execution is paused, you can step through it one line at a time, or you can skip over, into, or out of a function. These options allow you to monitor control flow and property values as you step through the code.
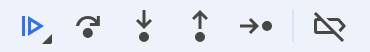
The JavaScript Debugging pane includes the Breakpoint control toolbar with buttons for working with breakpoints.
Button |
Action |
Description |
|---|---|---|
|
Resume script execution and Pause script execution |
Allows the code to run until the next breakpoint or to finish executing if there are no more breakpoints. |
|
Step over next function call |
When paused on a line of code that contains a function, Step over next function call executes all the code in the function and then pauses. |
|
Step into next function call |
When paused on a line of code that contains a function, Step into next function call pauses on the first line inside the next function. |
|
Step out of current function |
When paused inside of a function, Step out of current function executes the rest of the function's code and then pauses. |
|
Step |
Executes the current line of code and then pauses. |
|
Deactivate/Activate breakpoints |
Toggles all breakpoints between deactivated and activated, leaving the breakpoints in place. |


Conditional Line-of-Code Breakpoints
Use a conditional line-of-code breakpoint to pause only when the condition evaluates to true.
- Right-click the line number for
this.counter += operand(below the breakpoint you added), and select Add conditional breakpoint.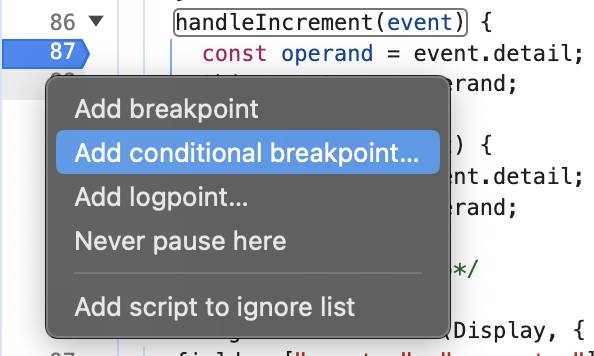
- Enter
this.counter > 1and then press Enter.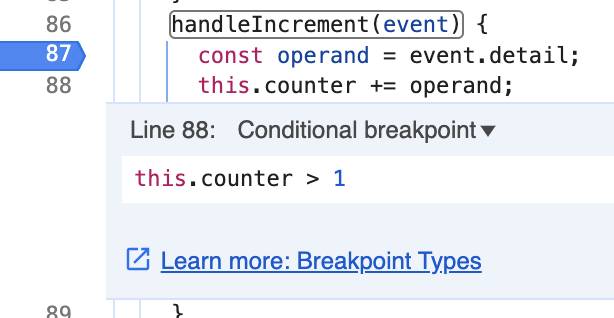
The conditional breakpoint is indicated by an orange pointer highlight with a question mark (?) to show that it's conditional.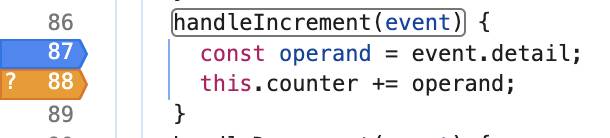
Move your mouse pointer overthis.counter. Its value is 0, so it doesn't meet the condition of the conditional breakpoint.

- Click Resume script execution
 . Notice that the code runs without stopping at the conditional breakpoint.
- In the Solutions app, click +1. Execution pauses at the first breakpoint. Now the value of
this.counteris 1.
- Click Resume script execution
 . Again, the code runs without stopping at the conditional breakpoint.
- Click +1. Execution pauses at the first breakpoint. Now the value of
this.counteris 2, so the conditional breakpoint should cause code execution to pause.
- Click Resume script execution
 . Did script execution pause at the conditional breakpoint this time?
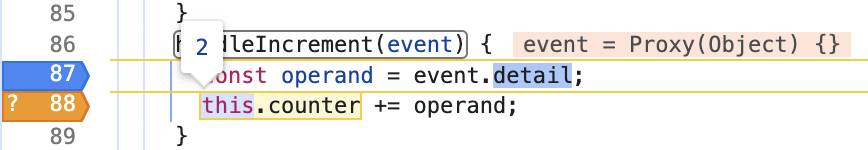
Manage Breakpoints
When you set several breakpoints in different files, they can be hard to keep track of. That's when Breakpoints (the fifth item in the JavaScript Debugging pane) comes in handy. Under Breakpoints, you can disable or remove line-of-code breakpoints.
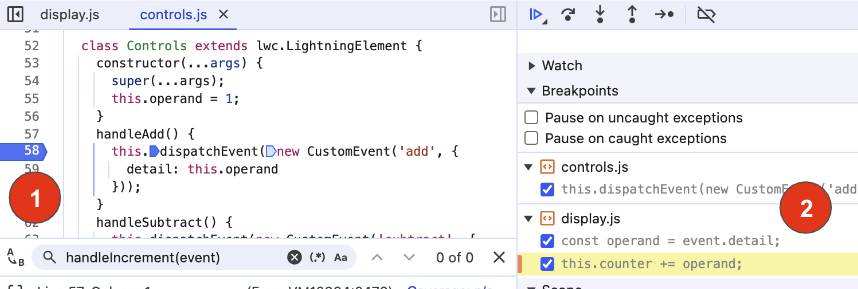
Notice the breakpoint (1) in the handleAdd function in control.js. It's also displayed in Breakpoints (2) along with the breakpoints from display.js.
Under Breakpoints, you can disable a single breakpoint by clicking its checkbox. Right-click anywhere in Breakpoints for more options.
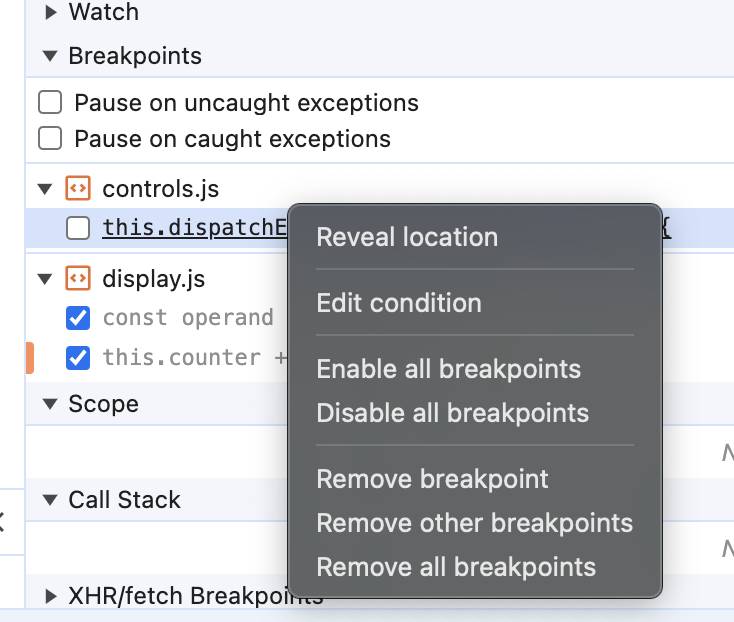
When a breakpoint is unselected in Breakpoints, its pointer highlight at the code line number changes to a lighter blue, indicating that the breakpoint is inactive.
Event Listener Breakpoints
Scroll down the JavaScript Debugging pane to find Event Listener Breakpoints. Here you can set breakpoints to pause on the event listener code that runs after an event is fired. There are many different options to select from. You can pause on a whole category of events, or pause on only a specific type of event.

Resources
- Chrome DevTools: JavaScript Debugging Reference
- Chrome DevTools: Pause Your Code with Breakpoints
- Salesforce Developers Blog: Step Up Your LWC Skills – Part 2