Get Ready to Troubleshoot
Learning Objectives
After completing this unit, you'll be able to:
- Explain the benefits of working with unminified code.
- Demonstrate how to get unminified Lightning web components.
- Locate Lightning web components JavaScript in DevTools.
- Use Ignore List to focus on your code only.
- Enable custom formatters for proxied decorators.
Lightning Web Components Have Unique JavaScript Challenges
Troubleshooting JavaScript is a skill of its own. Troubleshooting Lightning web components, built with JavaScript, takes that skill and builds on it. One of the first things you discover is that Lightning web components are compiled and minified. Minification makes them smaller and faster for the browser to load. But it also makes them challenging to troubleshoot. Minified code is especially hard to work with because line breaks are removed and variable names are changed.
Before You Begin
The developer tools in most browsers have similar features. We focus on Chrome DevTools in this module. Let's set up an environment so you can explore DevTools.
We assume that you have your Salesforce DX development environment set up, and that you're comfortable using it to create Lightning web components and deploy them to an org. If you're not familiar with this process yet, complete the Quick Start: Lightning Web Components project before you continue in this module.
Follow Along with Trail Together
Want to follow along with experts as you work through this step? Take a look at this video, part of the Trail Together series on Trailhead Live. You can find a link to the full session in the Resources section.
Set Up Your Troubleshooting Environment
First, you need to set up a Trailhead Playground with a couple of Lightning web components and prepare it for troubleshooting.
Ready to Get Hands-on with Lightning Web Components?
Create a new Trailhead Playground now to follow along and try out the steps in this module. Scroll to the bottom of this page, click the playground name, and then select Create Playground. It typically takes 3–4 minutes for Salesforce to create your Trailhead Playground. You also use the playground when it's time to complete the hands-on challenges.

Enable Debug Mode
This one step makes troubleshooting code much easier. Although the Lightning web components are still compiled, with Debug Mode enabled in the org, they're not minified. So, the variable names remain the same and the general structure of the code remains, making it much easier to troubleshoot.
- From Setup enter
Debug Modein the Quick Find box, and then select Debug Mode.
- Check the box next to your user.
- Click Enable.
Disable Caching During Development
Disable the secure and persistent browser caching setting to see the effect of any code changes without emptying the cache.
The caching setting improves page reload performance by avoiding extra round trips to the server.
- From Setup, enter
Sessionin the Quick Find box, and then select Session Settings.
- Deselect the checkbox for Enable secure and persistent browser caching to improve performance.
- Click Save.
After disabling the browser caching setting, you can reload a page to test your code changes without clearing your cache. We recommend that you re-enable the browser caching setting after debugging your code.
Grab the Lightning Web Components from GitHub
- Complete the instructions in the GitHub repo readme.
- From the App Launcher
 in your playground, find and open Solutions (under Items).
Your environment is now ready to do some troubleshooting using the browser DevTools.
Check your understanding of key points from this section with these flashcards.
Read the question or term on each card, then click or tap the card to reveal the correct answer. Click the right-facing arrow to move to the next card, and the left-facing arrow to return to the previous card.
Open DevTools
Let's look at the Solutions app with the Chrome DevTools.
- From the App Launcher
 in your playground, find and open Solutions (under Items).
- Right-click the browser window and select Inspect and then click the Sources tab.
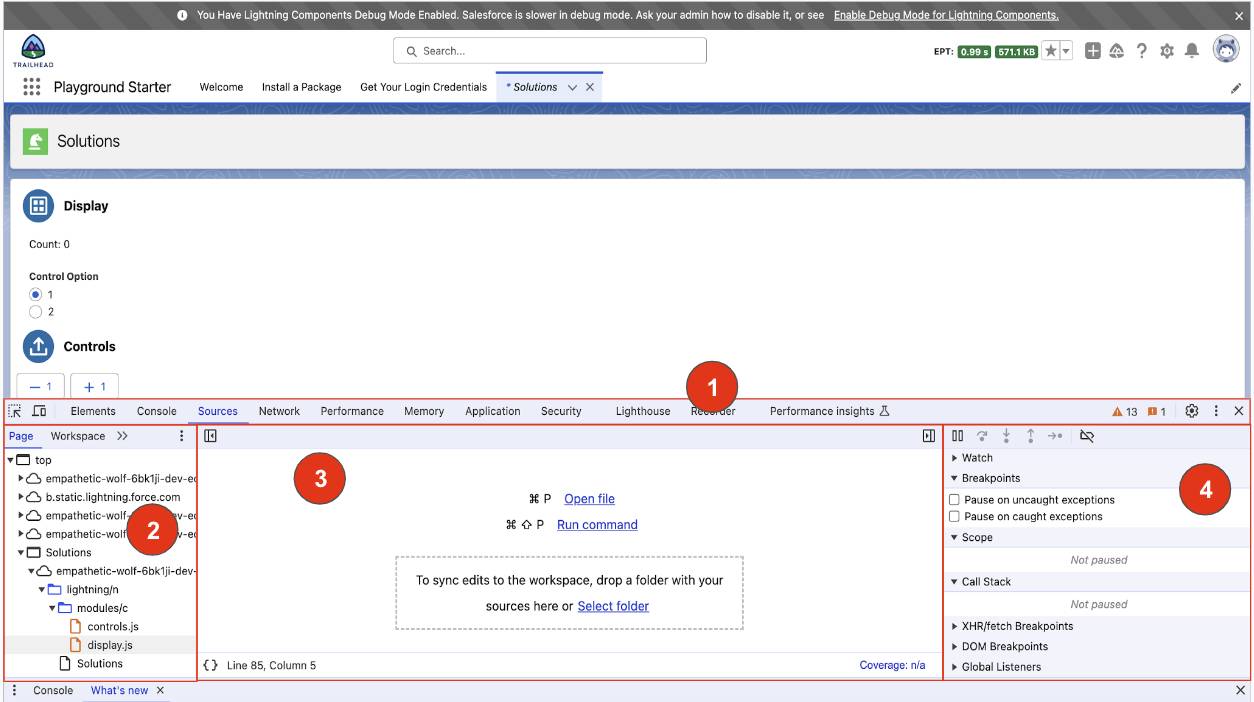
DevTools contains the DevTools Menu (1) and, when the Sources tab is selected, the Sources panel, which contains:
- The File Navigator pane (2) lists all files requested from this web page.
- The Code Editor pane (3) displays files selected in the File Navigator.
- The JavaScript Debugging pane (4) contains the Breakpoint control toolbar and several tools you can use to inspect JavaScript.
DevTools Menu
The DevTools menu has several options that allow you to view different parts of the browser. In this module, we work mostly with Sources and Console.
- Use the Elements panel to view and change the DOM and CSS.
- Use the Console panel to read messages such as those created with
console.log(), interact with variables, and run JavaScript.
- Use the Sources panel to view and debug JavaScript files.
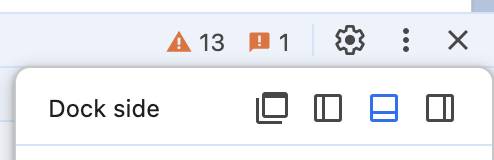
Change the Location of DevTools
By default, the tools are docked to the right side of the screen. The tools can also be docked to the left or bottom of the screen or even undocked into a separate window.
Click Customize and control DevTools  and select the dock side you want to use. (Images in this module show DevTools docked at the bottom.)
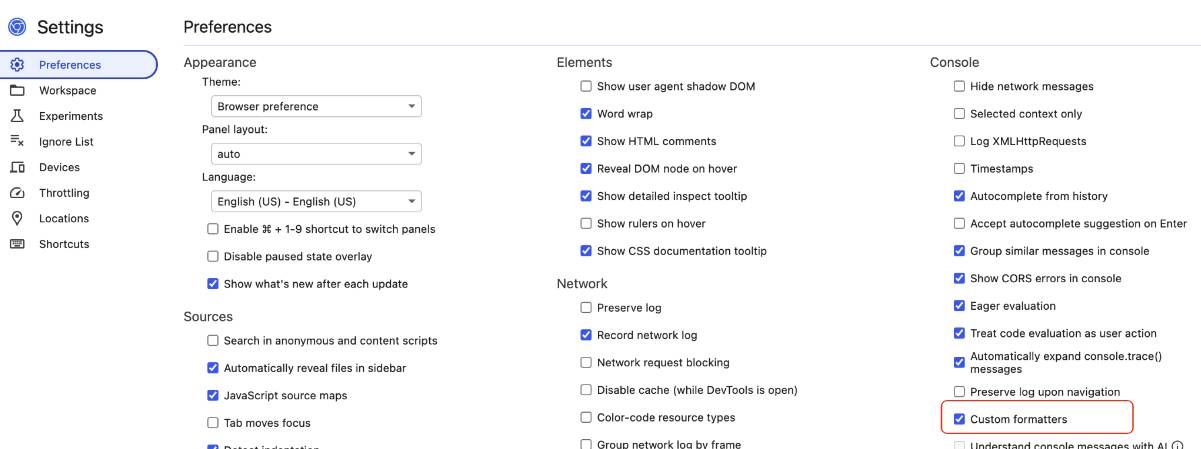
Enable Custom Formatters
Lightning web components use JavaScript proxies to enforce that certain types of data are read-only, primarily data that's provisioned via decorators (@api, @track, @wire). In Debug Mode, custom formatters manipulate the proxies into readable parts. Then in Chrome DevTools, you see the real value instead of the proxy. Let's enable the custom formatters.
- In DevTools, click Settings
 . The Preferences page opens.
- Under Console, select Custom formatters.
Use Ignore List
Ignore List lets you ignore selected JavaScript files when using DevTools, so that you only pause on your own exceptions. This allows you to ignore framework code that you don't want to troubleshoot.
- In Settings, click Ignore List.
- Click Add regex rule.
- Enter
/components/.*.js$and then click Add.
- Close Settings.
Locate the Lightning Web Components
Under Sources, the Lightning web components are displayed in the File Navigator (under Page). All of the custom Lightning web components for the current page are in the modules/c folder.
- In DevTools, click the Sources tab.
- In the File Navigator, under Page, expand lightning/n and then modules/c.
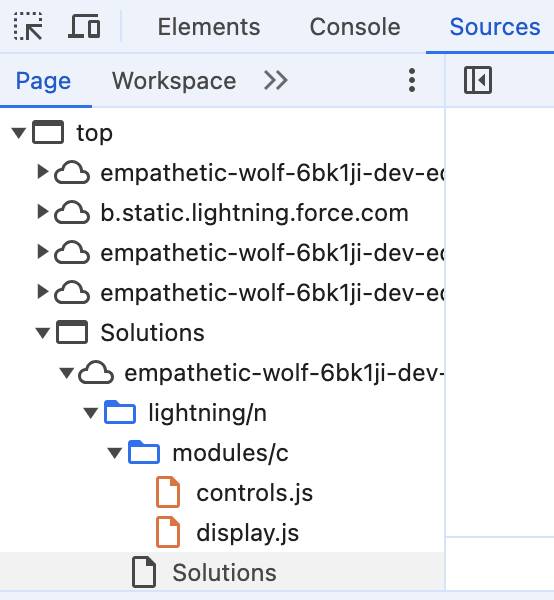
- Click display.js. The file opens in the Code Editor.
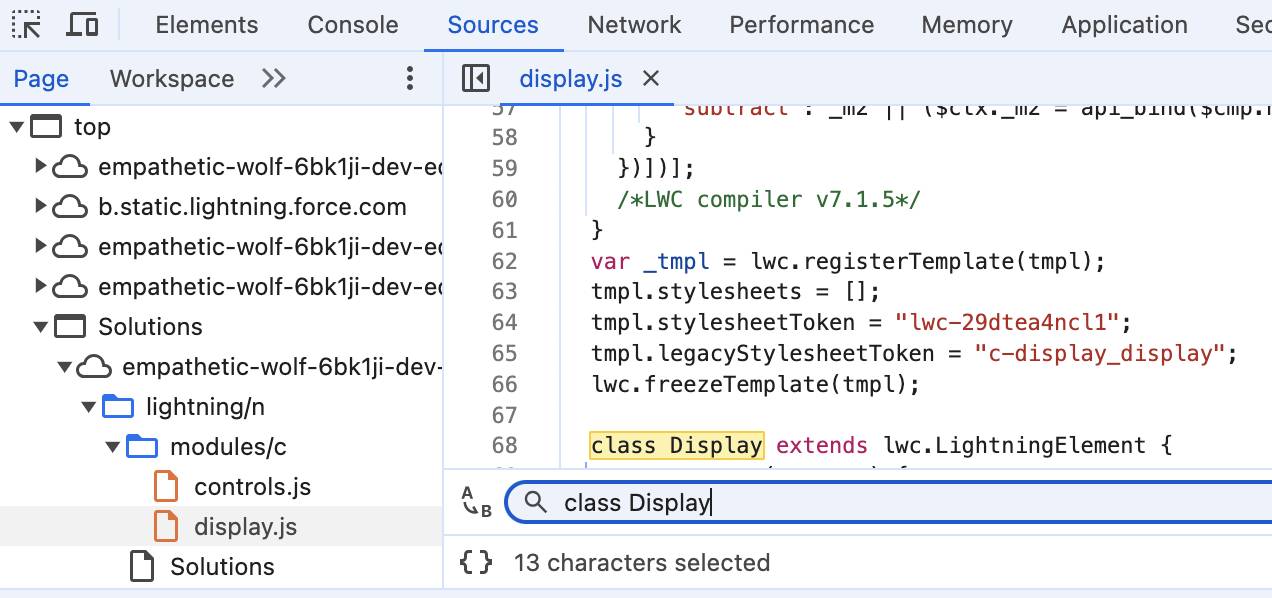
- In display.js find
class Display. (Click inside the Code window and press Ctrl+F (Windows) or Cmd+F (macOS). In the Find box, enterclass Display.)
Notice that the code is compiled, but not minified, so the variable names are not changed.
Check your understanding of key points from this section with these flashcards.
Read the question or term on each card, then click or tap the card to reveal the correct answer. Click the right-facing arrow to move to the next card, and the left-facing arrow to return to the previous card.
You start working with these new tools in the next unit.
Resources
- Lightning Web Components Dev Guide: Enable Debug Mode in Salesforce
- Salesforce Developers Blog: Debug Your Lightning Web Components
- Lightning Web Components Video Gallery: Debug Lightning Web Components
- Salesforce Developers Blog: Step Up Your LWC Skills - Part 1
- Chrome DevTools: Debug JavaScript
- Chrome DevTools: Overview