Visualize Success with Path and Kanban
Learning Objectives
After completing this unit, you’ll be able to:
- Update a record’s stage or status using Path.
- Update records in the Kanban view.
- Use filters and view charts in the Kanban view.
Track a Deal with Path
Path is a simple tool with some powerful features. You may have already noticed it on lead and opportunity records as you worked through the other units in this module.
Path shows you at a glance where the record is in your sales process. It’s a quick indicator that helps you visualize where you are and where you’re going.


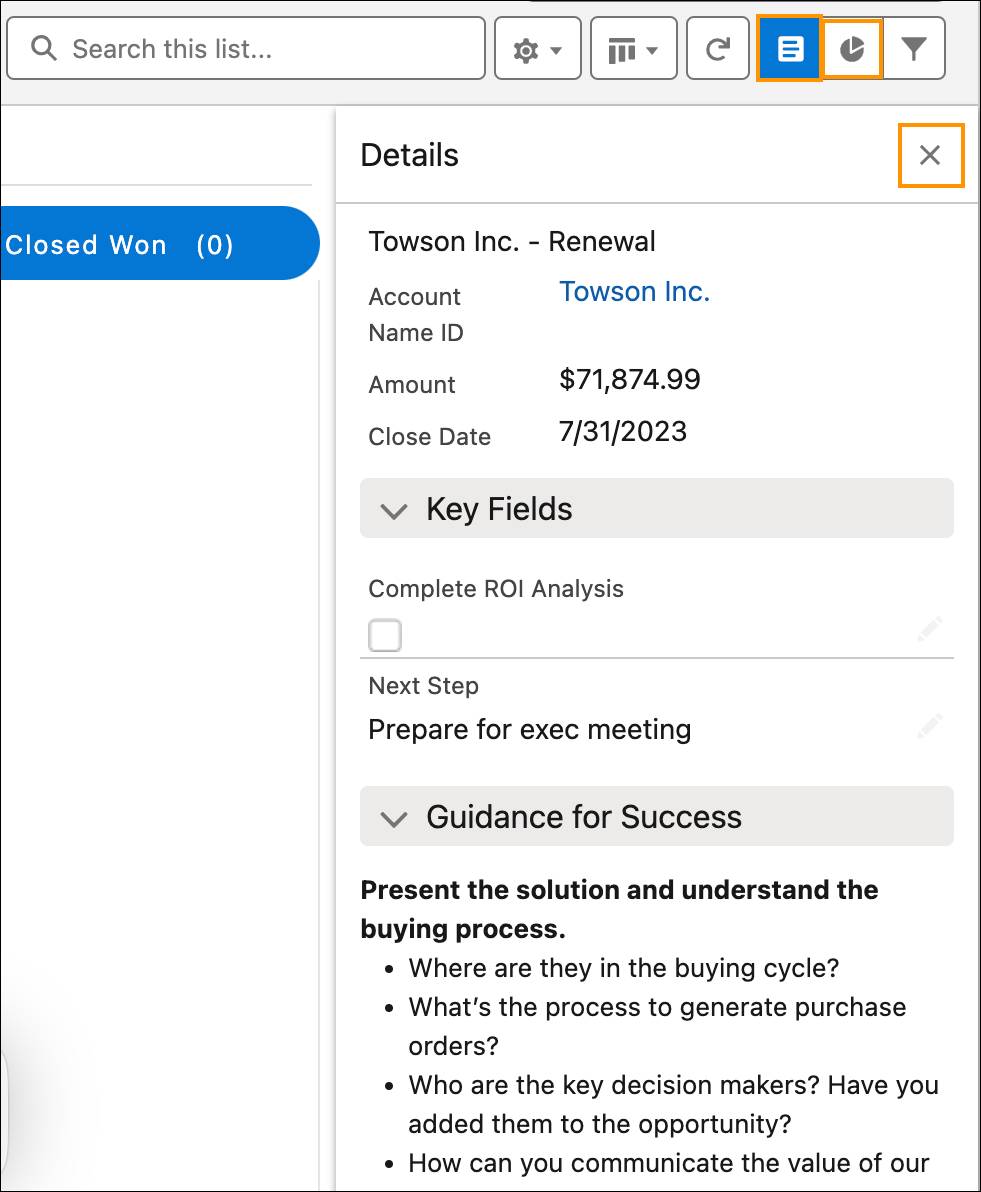
Key Fields highlight the information you need the most when you open a record, so you don’t have to switch tabs or scroll around to find critical data.
If you’re new to your job or company, Guidance for Success (provided at each step on a Path) can help you get up to speed quickly and make sure you don’t miss any critical activities.
Use Path to update a record’s status by clicking Mark Status as Complete. This moves the record to the next step on the path. It’s easy to select a different status if your deal loses steam and you need to retreat to a previous status, or moves so fast you need to skip ahead. Click the step on the path you’re moving to, then click Mark Current Status.
To create a path:
- Navigate to Set Up and enter
pathin the Quick Find box. Select Path Settings.
- If you haven’t already, enable Path. Select New Path.
- Enter the following information about your path:
- Path name
- Object to base the path on
- Record type
- Picklist to base the path.
- Click Next.
- Select key fields and enter success guidance. Note: For each step on the path, you can select up to five key fields and enter up to 1,000 characters of guidance for each step on the path.

- Click Next.
- Complete either of the following:
- Activate the path immediately.
- Return to Path Settings to activate the path later.
- Select picklist values and a frequency for triggering the celebration animation.
- Click Finish.
Manage Records in the Kanban View
The Kanban view provides a big-picture view of all your work. It lets you easily sort, summarize, filter, and move your opportunities along your pipeline. You can use the Kanban view as a workspace.
Let’s check out the Kanban view for opportunities.
- Select the Opportunities tab.
- Select the All Opportunities list view.
- From the Select list display
 dropdown, select Kanban.
We’ve picked the All Opportunities list view because it gives us the most data to work with in this unit, but you can view the Kanban view on almost any list view.
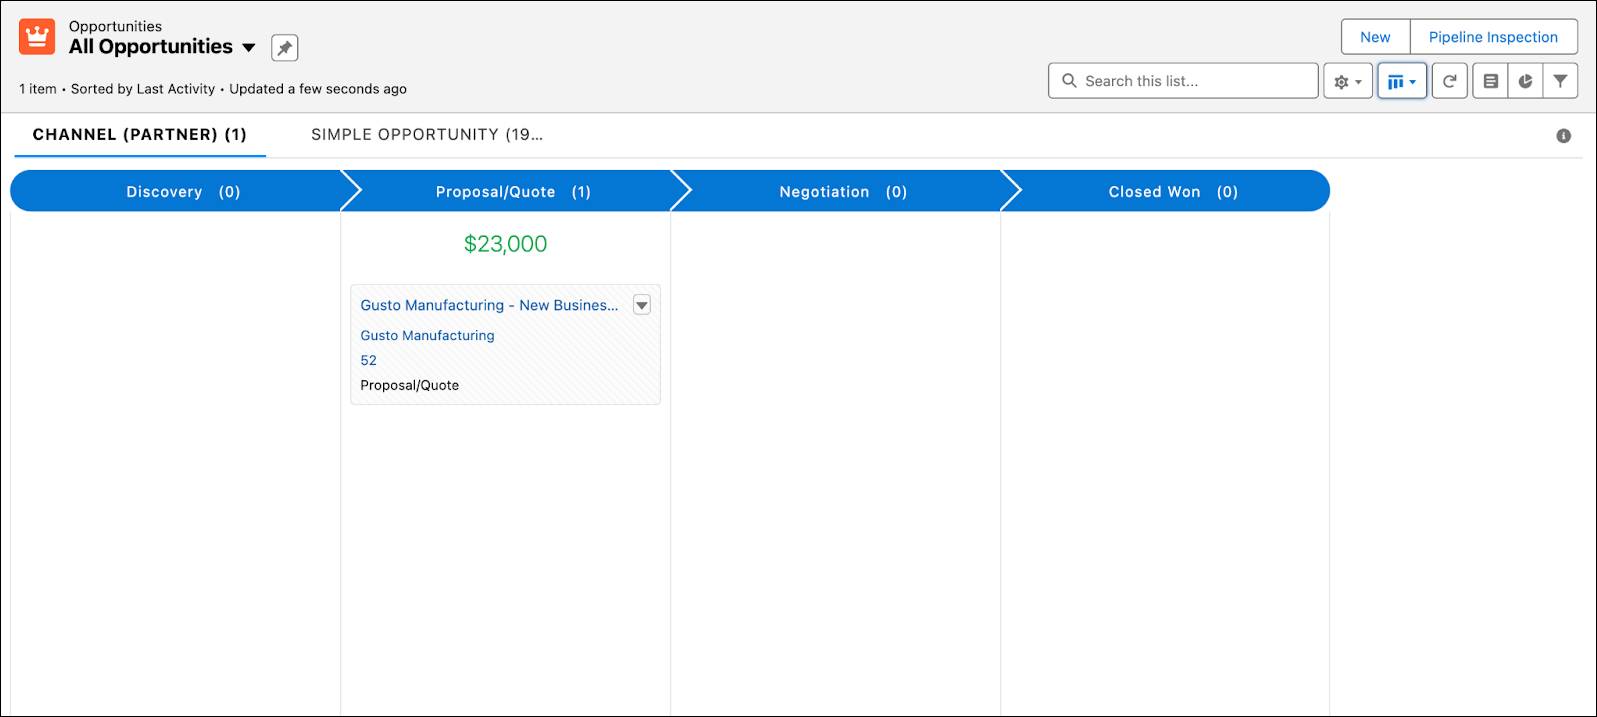
Move an Opportunity to the Next Stage
By default, the Kanban for opportunities is organized by Stage. Each column represents one stage.
Here’s how to move an opportunity to the next stage in this view.
- Click any deal in the column on the left.
- While holding down the mouse, drag the deal’s card into a different column.
- Release the mouse button.

And, you’re done.
Take Action on Your Opportunity Records
You can make other changes, too. Just click the down arrow on a Kanban card, and select Edit. Make your update in the record right within the Kanban view.

You can also delete a record or change the opportunity’s owner.

View a Chart of List View Data
Kanban provides a few different options for viewing your data.
-
Show charts displays a chart or graph that summarizes the data in your list view. If
 is grayed out, your view may not have any opportunities. Ensure your Opportunities view contains data by selecting the All Opportunities list view to display opportunity items and their corresponding charts.
- Select Pipeline by Account to view which account you’ve done the most business with.
- Select Pipeline by Stage to view the stage for each deal. Hover the mouse over a section of the chart for more details, or look below it.
- Click Settings to change the format of your Pipeline by Stage chart.
- Click the X to close the Chart sidebar when you’re finished reviewing your charts.
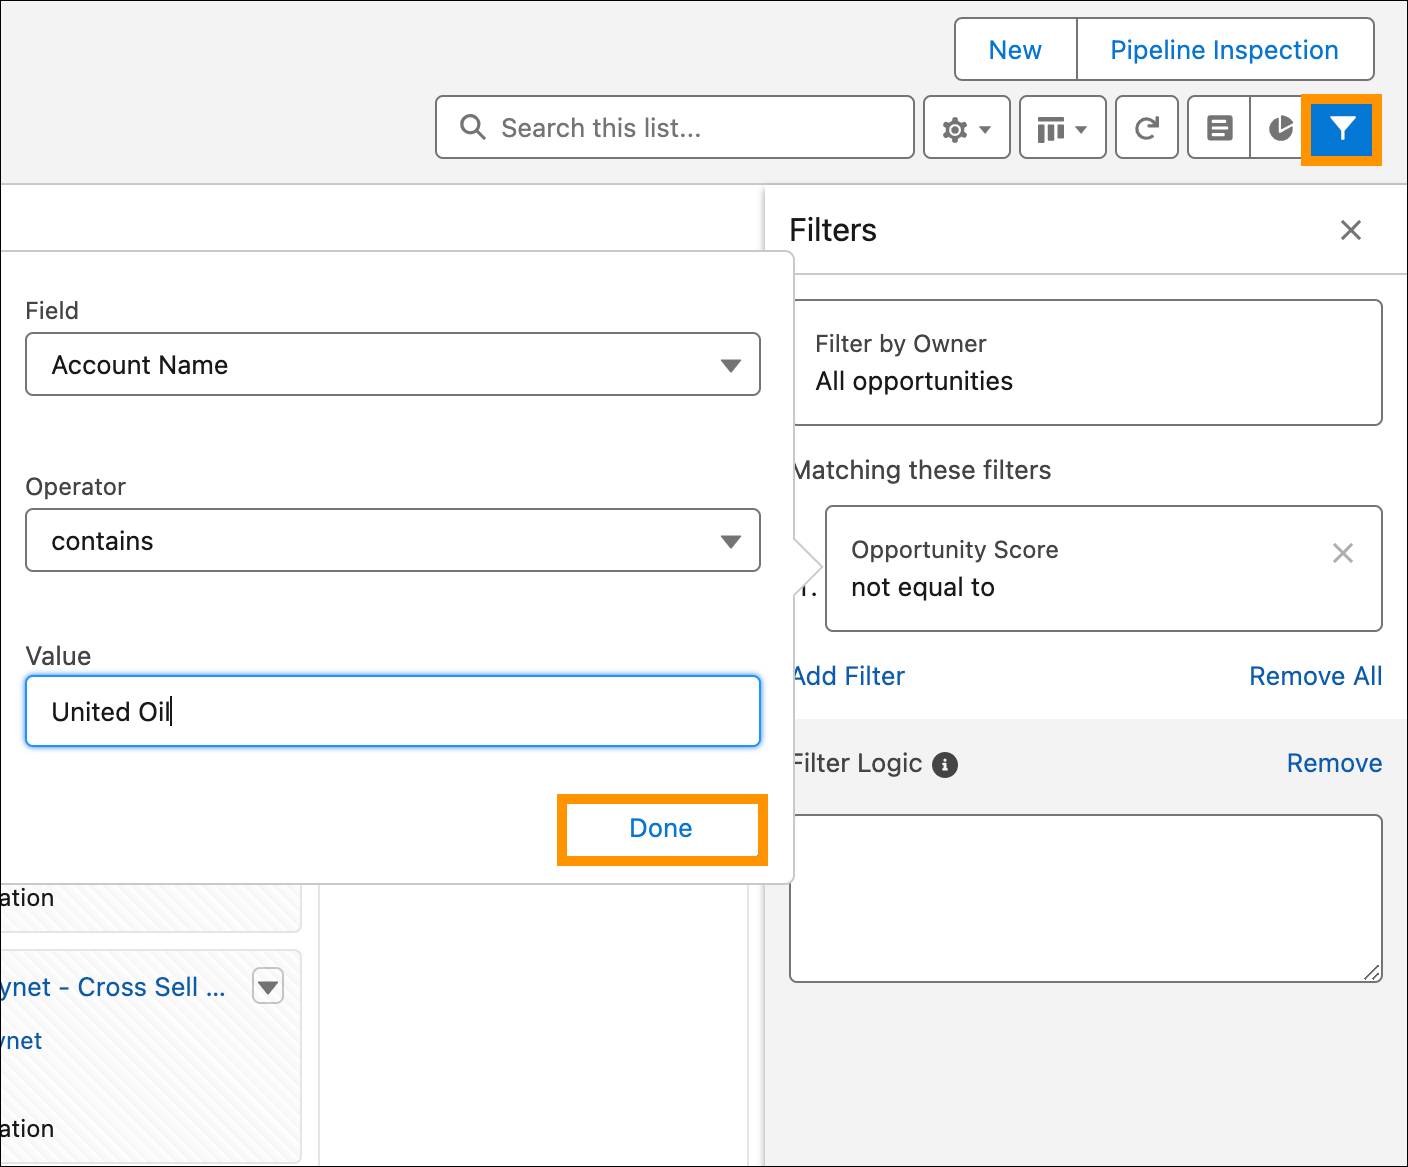
Filter the Kanban View
When lots of business is coming in, you can use filters to narrow down your records to quickly review specific records in your list view.
- Click Show filters.
- Click Add Filter.
- Add the filter:
- Field: Account Name
- Operator: contains
- Value:
United Oil
- Click Done.
- Click Save.
- To hide the filter settings, click X.
Now, your Kanban view shows account records that have the word United Oil in their names—deals you’ve done with the United Oil Plant Standby Generators account.
You can use the filters to sort your records in multiple ways. For example, you could find deals created after a certain date, or deals whose Last Activity date was in the distant past.
However you filter your records, remember to disable the filter when you’re done. To disable the filter, click Remove All. Then, click Save.
Change the Kanban View
By default, the Kanban view for opportunities organizes your records into columns by Stage. It also shows a summary of the deals in each column based on the sum of the Amounts of each column’s opportunities. However, you can change the columns where records are organized and the numbers used in the summary.
- Click the Select list display button
 .
.
- Select Kanban.

- Click List View Controls and select Kanban Settings.
- Change Summarize By to Expected Revenue.
- Change Group By to Type.

- Click Save.
When the Kanban view reloads, it shows your opportunities organized into columns based on the opportunity’s type. The summary at the top of each column is the sum of expected revenue for each type.
Wrap It All Up
Tracking, managing, and updating your records is easier than ever with Path and Kanban. The Kanban view is available to all Salesforce users for most objects, including Leads, Tasks, and more. Path needs to be enabled and configured by a Salesforce admin.
Resources