Give Sales Agents a 360-Degree View of Policyholders
Learning Objectives
- List key features of the Insurance Agent Console.
- Describe the Policy Tab in the console.
Get Started with Insurance Agent Console
The big day arrives when Cumulus goes live with Insurance Agent Console. Zeynep logs in and sees useful charts and metrics.
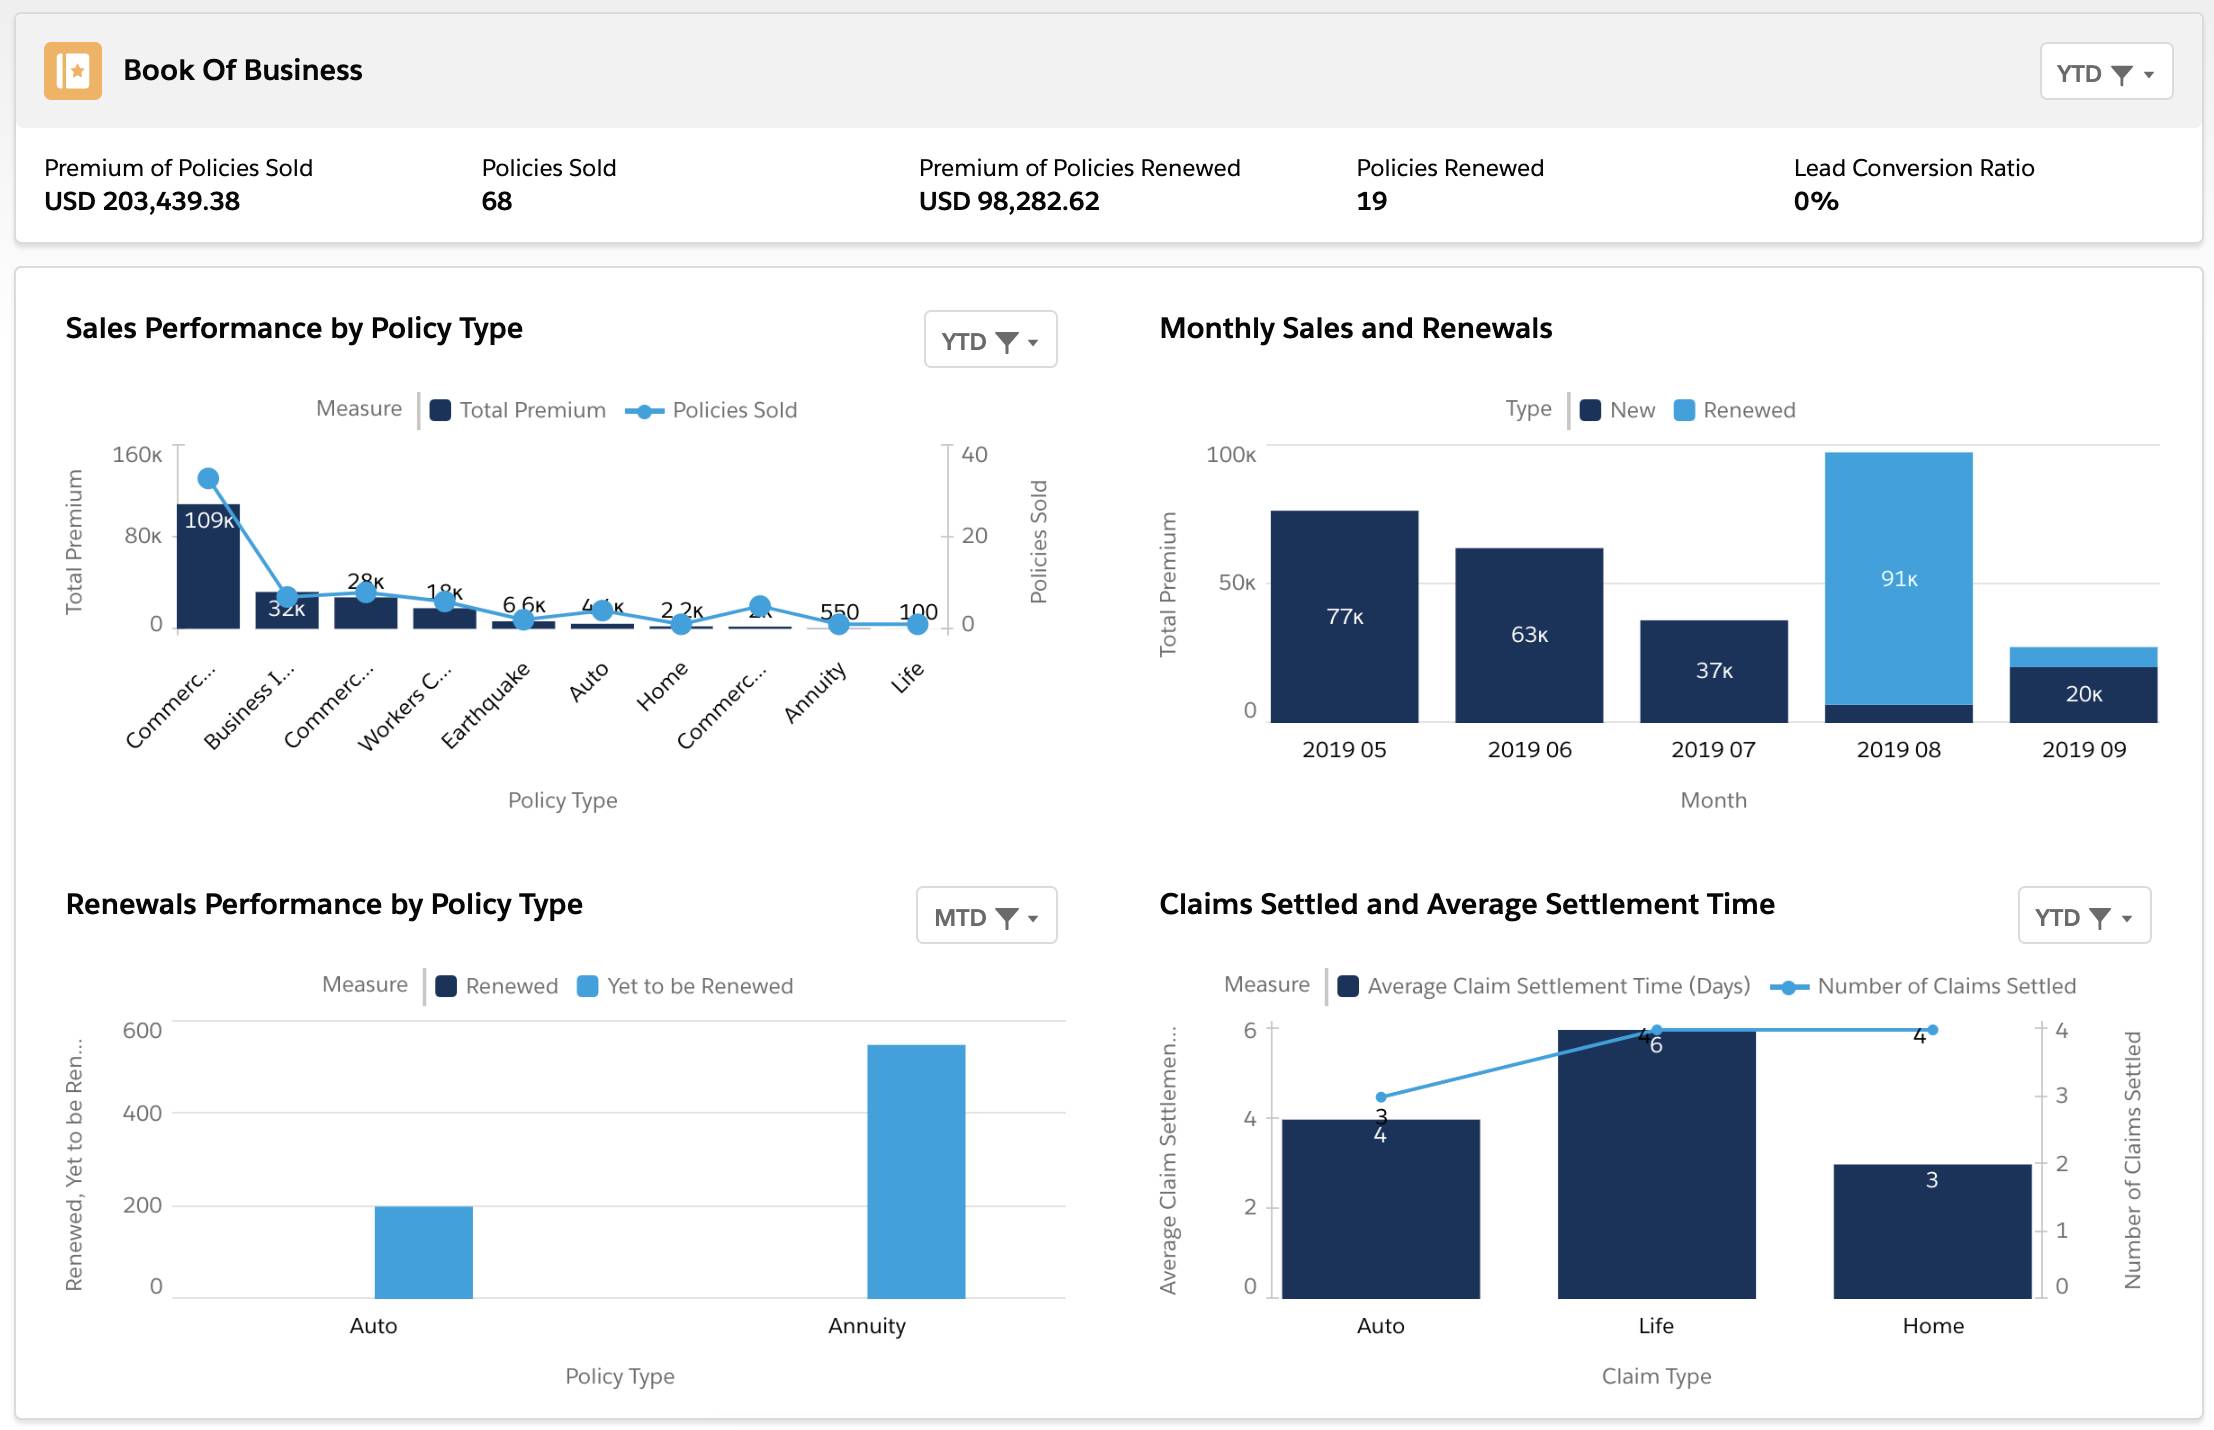
Zeynep now has access to important stuff like the total premium of all policies she sold and renewed, the number of policies she sold and renewed, and her lead conversion ratio.
- Performance breakdown for various policy types
- How to compare and contrast total premium earned with the number of policies sold and renewed
- How her renewals and new sales compare over time
Slice and Dice Sales Performance Data by Time
Zeynep can also filter the data in the performance metrics and some of the charts by time: month-to-date (MTD), quarter-to-date (QTD), and year-to-date (YTD).
- From the App Launcher (
 ), find and select Insurance Agent Console.
 - Select Home from the navigation bar.
- Go to the Sales Performance by Policy Type chart and select YTD from the dropdown.
Policyholder 360 at a Glance
After some practice using the console, Zeynep decides it’s time to use it to enhance her customer interactions. Zeynep wants to reengage Rachel, but first she wants to prepare. She logs in to the console to get a full understanding of Rachel.
From the navigation bar, she selects Accounts, switches to the All Accounts list view, and then selects Rachel Adams (Sample). The Person Account page for Rachel Adams opens up as a new tab in the navigation bar.
Here’s what she learns.
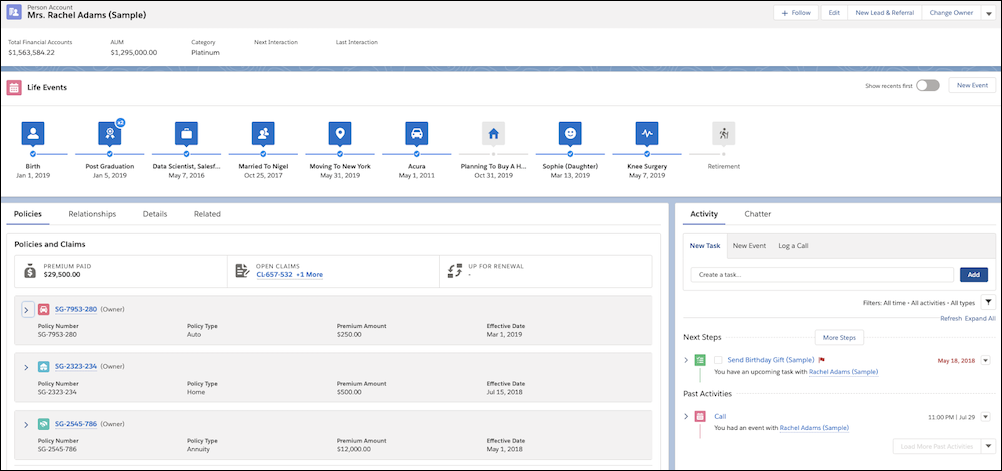
- First, there’s a highly visual representation of key events in Rachel’s life, including her birthday, education and work info, and marital status. We tell you more about this new feature, called Life Events, later in this unit.
- There is a Policies tab, which includes all the various policies owned by Rachel, and the claims filed against each policy.
Zeynep has a full, 360-degree view of Rachel Adams as a policyholder. Now Zeynep is better prepared for her upcoming conversation with Rachel to review her portfolio.
We take a look at each of these new features in the following units.