Use Acquisition Reports
Learning Objectives
After completing this unit, you’ll be able to:
- Describe how you can use Acquisition Reports.
- Explain the different traffic sources that you can track for your website.
- Describe sample Acquisition Reports.
Get to Know Acquisition Reports
You can use Acquisition Reports to compare the performance of different marketing channels and discover which sources send you the highest-quality traffic and conversions. This can help you make better decisions about where to focus your marketing efforts.
Acquisition Reports are under Acquisition in the left-hand navigation.
Understanding Traffic Sources
Before we discuss Acquisition Reports, it can be helpful to know how Google Analytics identifies traffic sources for your website. When a user lands on your site, the Google Analytics tracking code automatically captures several attributes (or, dimensions) about where the user came from. This includes the traffic medium, source, and marketing campaign name.
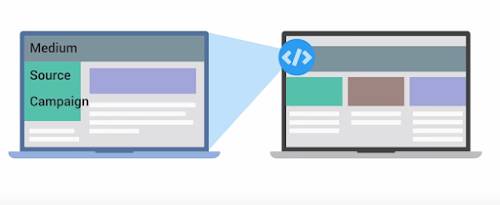
Medium
You can think of the medium as the mechanism that delivered users to your site: a search engine or an ad, for example. Let’s look at some common types.
- Organic describes traffic that arrived on your site through unpaid search, such as users who ran a search of their own and saw a link to your site in their results.
- CPC indicates traffic that arrived through a search campaign you paid for, like Google AdWords text ads.
- Referral describes traffic that arrived on your site after the user clicked on a website other than a search engine.
- Email represents traffic that came from an email marketing campaign.
- (none) applies to users who came directly to your site by typing your URL into a browser. In your reports, these users have a source of “direct” with a medium of “(none).”
Source
The source provides more information about the medium. For example, if the medium is “referral,” then the source is the URL of the website that referred the user to your site. If the medium is “organic,” then the source is the name of the search engine.
A Sample Traffic Sources Report
In the accompanying screenshot, under All Traffic, let’s look at the Source/Medium report in the Google Store Analytics account using the dates August 1, 2015, through August 31, 2015. This report shows the sources and their respective mediums sending referrals, search engine traffic, and direct traffic to the site. The default sort is users.
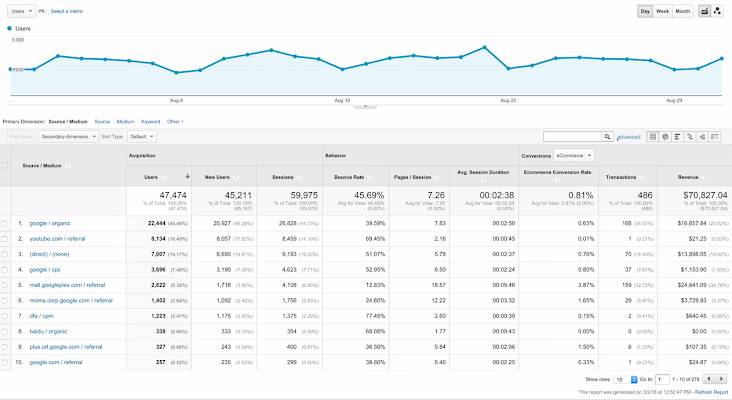
To identify effective traffic sources, we can look at the source and medium combinations with the most users, but that doesn’t necessarily mean this was the best traffic. Ideally, traffic is “high quality”: users who arrive from a source engage with the website or complete a conversion. A good indicator of traffic quality is bounce rate. The top traffic source in this report is Google organic search, which has a relatively low bounce rate compared to other sources.
The second most popular source is YouTube, but it had one of the highest bounce rates.
Let’s do a bit more analysis to understand if this is a problem.
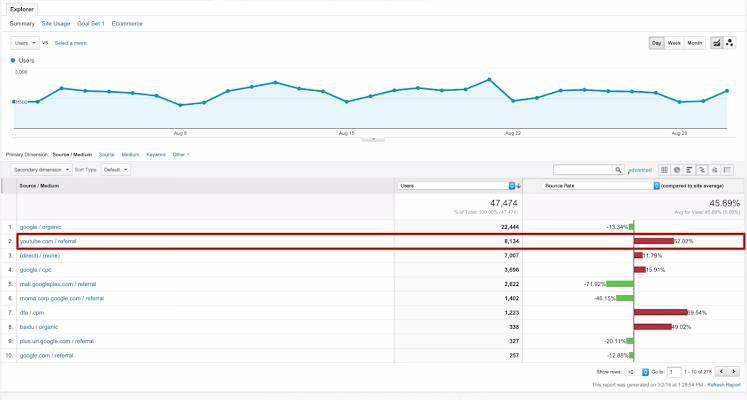
We can click into the comparison view and select the bounce rate metric to compare bounce rate for each source/medium combination to the site average. Sure enough, we can see that our YouTube traffic is bouncing at a much higher rate than the site average. The Google Store may want to investigate to make sure that YouTube traffic is landing on a page that’s valuable to those users.
If we want to see only the organic sources sending traffic to the site, type “organic” into the search box above the table. In this example, Google referred more traffic than any other unpaid source and had a relatively low bounce rate compared to other sources. This means that users arriving from Google organic search are landing on highly relevant pages.
We can compare the performance for all of our various Google marketing activities that generated traffic by changing the filter to “google.” This reveals that organic traffic was the biggest traffic source, followed by google/cpc, which represents paid search traffic using Google AdWords. This is a great way to add context to your analysis and understand which marketing activities are generating success for your business.
Channels Report
There are other ways to view which traffic sources bring the most engaged users to the site. Using the Channels report, you can view traffic by channel, which bundles the sources together under each medium. Google Analytics automatically groups the traffic sources into basic categories (or, channels) like Organic, Social, Direct, Referral, and Display.
Clicking into each channel breaks out the individual sources for that channel. If you want to group your sources differently, you can create your own channel groupings in Google Analytics.
Referrals Report
If you want to view your traffic organized by which sites have linked to yours, look at the Referrals report. You can even click into individual referrals to see which specific web pages link back to your site. If you want to understand which specific pages of your site other websites are linking to, you can add a secondary dimension of “landing page” to the report. This shows you which external sites are sending traffic to each of your specific pages. Potentially, it offers you a source of new advertising partnerships with those referring websites.