Discover New Report Insights
Learning Objectives
After completing this unit, you’ll be able to:
- Explain how to launch Einstein Discovery for Reports from a report.
- Explain how to select a goal and create an analysis.
- Describe how to interpret correlations.
- Explain how to navigate and interpret insights.
Dive Deeper into Report Data with Einstein Discovery for Reports

When analyzing your Salesforce reports, it’s hard to know if you are overlooking significant details or trends that might help shape your course of action. Put Einstein Discovery for Reports to work on your report data to make sure you’re uncovering the most relevant insights. Einstein Discovery for Reports scans your report data—quickly and thoroughly—using artificial intelligence and comprehensive statistical analysis powered by Einstein Discovery.
Einstein Discovery for Reports produces lightning-fast insights that are impartial, objective, and statistically meaningful. It uses colorful charts and fact-filled explanations to make it easy for you to digest and interpret the insights. Your job is simply to flip through the insights to find the ones most relevant to your business goals.
What’s Required To Use Einstein Discovery for Reports?
Einstein Discovery for Reports requires the CRM Analytics Plus license in your Salesforce org. In addition, your user account must be assigned the Can Run Einstein Discovery for Reports permission. If you’re unsure about permission settings, check with your Salesforce admin.
Now What?
Einstein Discovery for Reports works with any tabular or summary report that has at least two columns and 50 rows of data. It can analyze up to 50 report columns and 500,000 report rows. Clicking the Analyze button on the toolbar launches the Einstein Discovery for Reports panel.
You can either create an analysis (1) or launch an existing one (2).
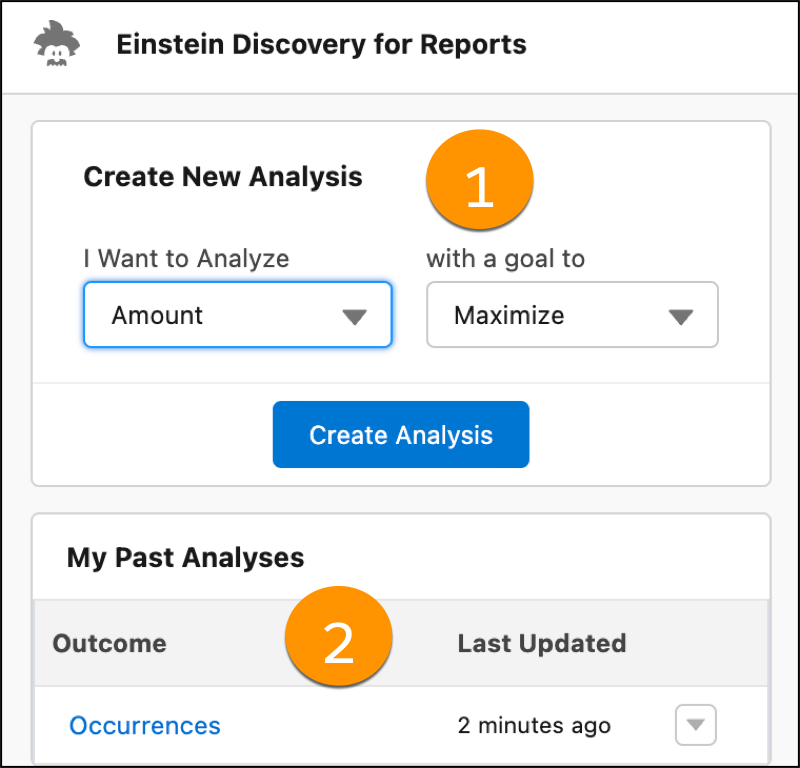
Creating a new analysis requires you to select the report column you want to analyze, along with your analytical goal (to minimize or maximize the report column). In this example, our goal is to maximize opportunity wins: IsWon (True). Clicking Create Analysis unleashes Einstein’s superpowers on your report data.
During analysis, Einstein Discovery for Reports calculates how each column impacts the goal (called a first-order analysis). It also calculates every combination of two columns and how those impact the goal (called a second-order analysis, which calculates the pairwise interaction effect on the report column you’re analyzing).
Examine Correlations
When the analysis is complete, Einstein Discovery for Reports shows a summary of the results (3), ranks correlations between report columns and the goal (4), and generates a list of insights (5).
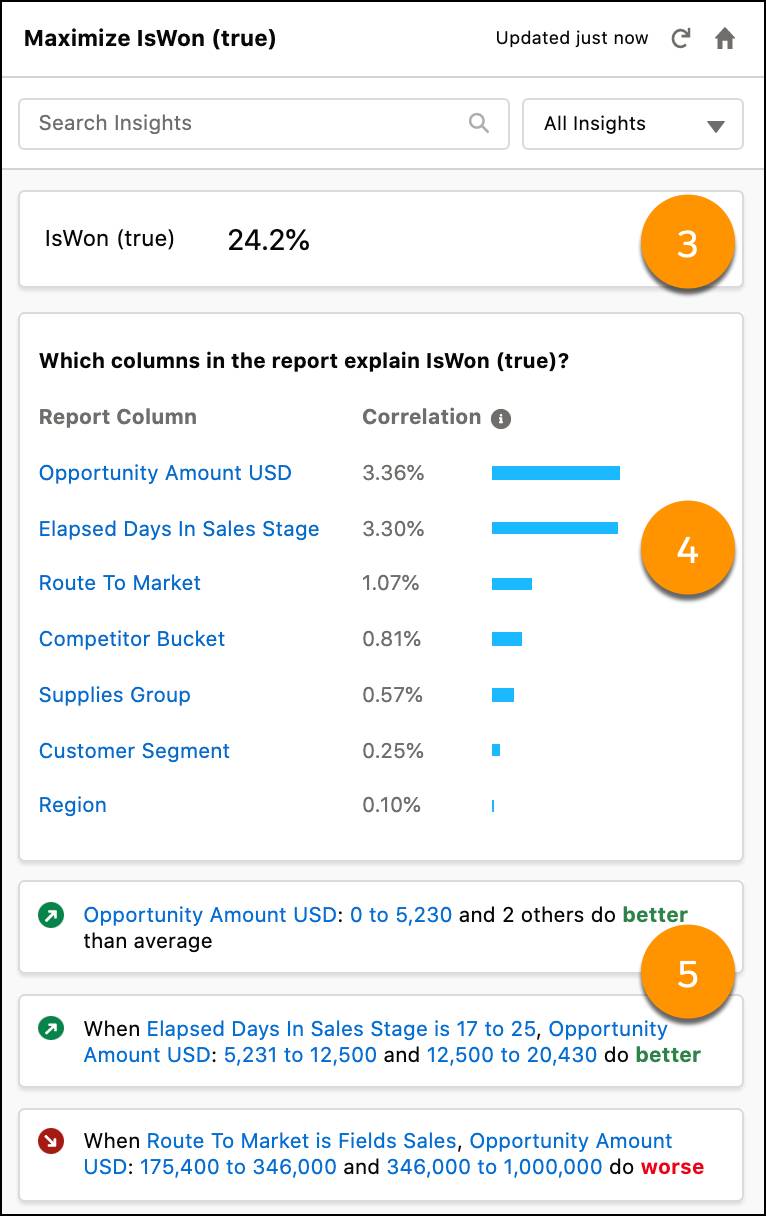
The higher the correlation, expressed as a percentage, the stronger the statistical relationship.
Keep in mind that correlation is not causation. Correlation merely describes the strength of association between variables, not whether they causally affect each other. It’s up to you to determine whether a correlation indicates anything more than just a statistical link.
Navigate and Interpret Insights
Einstein generates column-based insights from your report data and lists them in order of statistical significance. At the top are insights that have the highest impact on the stated goal.
Scan and Scroll Through the Insights List
The sheer number of insights shows us that Einstein Discovery for Reports conducted comprehensive analysis and calculations on your report data. Each insight has a self-descriptive title and summary. You determine how to best use those insights to achieve your business objectives.
Because you’ve given Einstein an analytical goal, such as maximizing opportunity wins, each insight indicates whether something “was better” or “was worse” in relation to that goal.
- A green circle with an arrow indicates a condition that takes you closer to your goal.
- A red circle with an arrow indicates a condition that takes you further from your goal.
Drill Into Insight Details
Clicking and expanding an insight shows more details, including a title and summary (6), explanations (7), and bar chart (8).
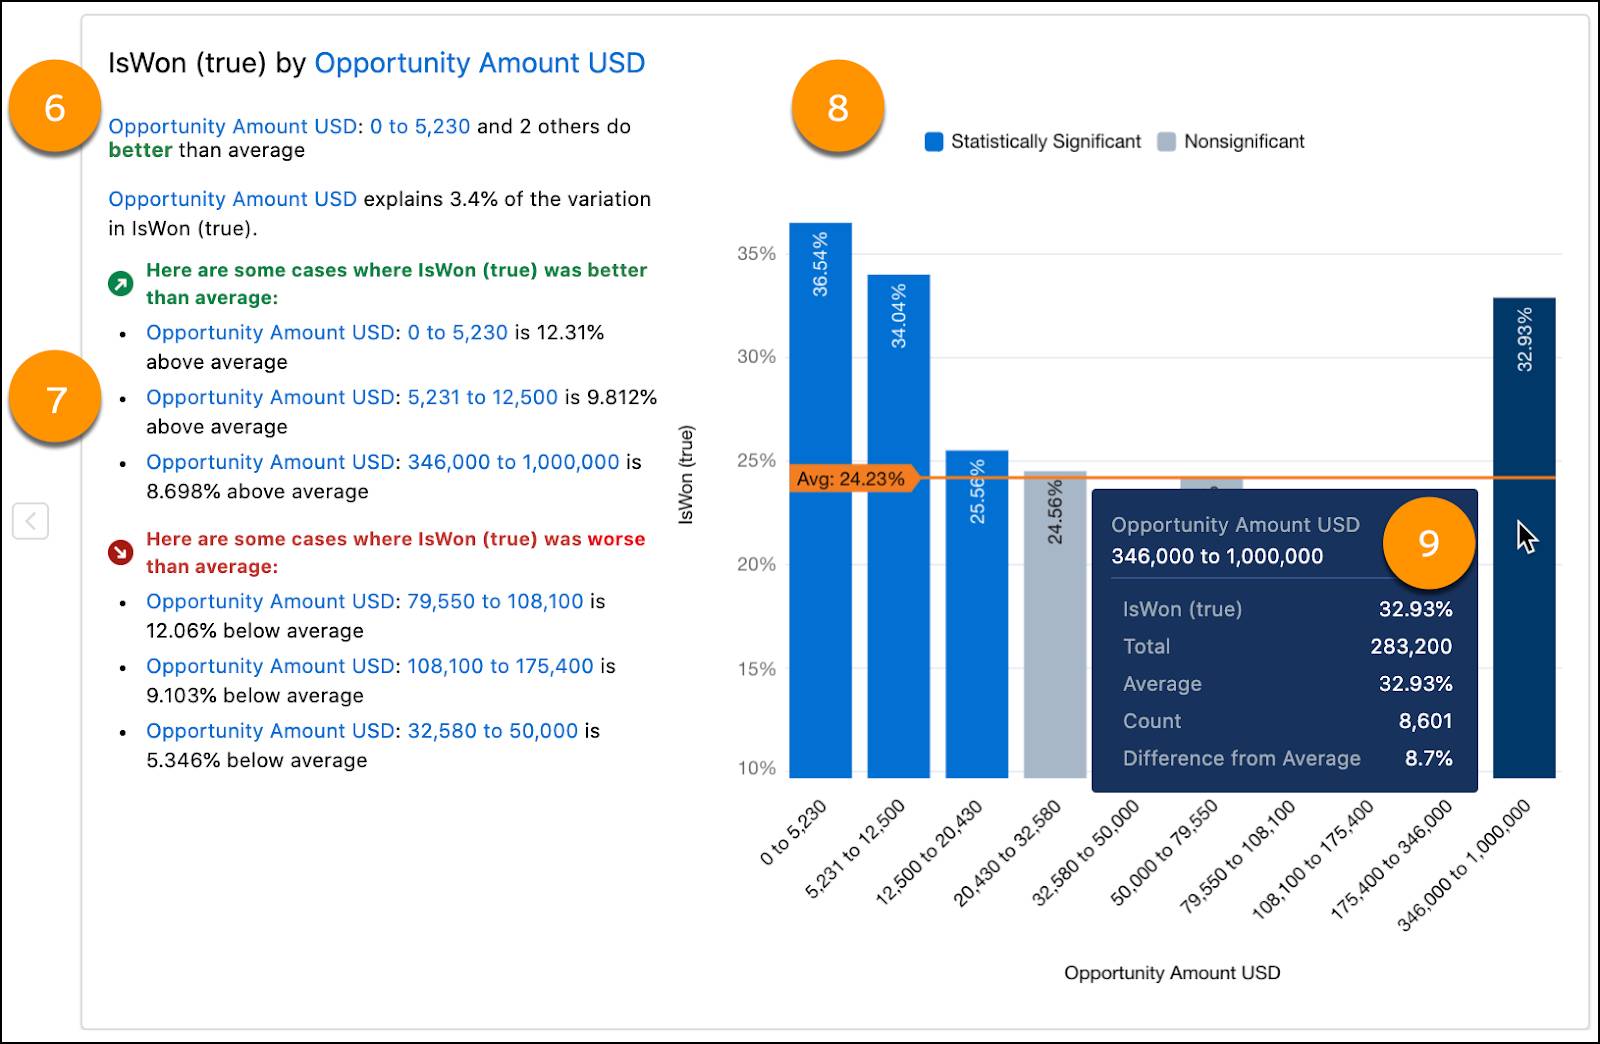
The bar chart shows you the average for all data (orange line) as well as which data is above or below average. Hovering over a bar in the chart opens a tooltip showing the underlying data (9).
Filter Insights
There are many ways to focus your investigation on the insights that are most meaningful to you.
- Clicking the report column name in the correlation summary focuses on insights that are linked to the selected column.
- Selecting a condition in Search Insights allows you to filter insights by a column value.
- Clicking All Insights allows you to filter insights by positive or negative impact on the goal you selected for analysis.
- Clicking any hyperlinked explanation text drills down into related insights.
- Clicking Show insights that are not significant at the bottom of the list shows all insights. By default, you see only the most statistically significant insights.
Best Practices for Einstein Discovery for Reports
To get the best results for your analysis, consider these suggestions:
- Avoid using report columns that contain:
- unique ID fields
- fields with high cardinality (over 100 unique values)
- high correlations to the analytical outcome
- Exclude rows that haven’t yet reached an outcome. For example, use closed opportunities or cases only.
For other suggestions, see Report Tips for Einstein Discovery for Reports in Salesforce Help.
Next Steps
Now that you’ve learned how Einstein Discovery for Reports can supercharge your report analysis, why not give it a try with some of your favorite reports?
Resources
- Salesforce Help: Analyze Reports with Einstein Discovery for Reports
- Salesforce Help: Reports
- Salesforce Help: Einstein Discovery
- Trailhead: Einstein Discovery: Quick Look