Create Scheduled Reports
Learning Objectives
After completing this unit, you’ll be able to:
- Explain what scheduled reports are and when to use them.
- Describe the different types of reports.
- Create a scheduled report.
Review Your Data with Reports
You can create a report when you want to retrieve, view, and share a detailed analysis of your data. You can either create a report from scratch or export an entity (like a pivot table or dashboard page) to a scheduled report, as you learned in earlier units. You have the ability to create a few different types of reports.
-
Flat Table (Excel/CSV): Creates a flat file with the data. For example, display the total number of sends per send date. This can also be achieved by using Schedule Export to a Flat Table on a predefined pivot table.
-
Pivot Table (XLS): Creates an Excel in the same structure as your pivot table view. This can also be achieved by using Schedule Export to a Pivot Table on a predefined pivot table.
-
Dashboard (PDF): Exports a dashboard into a PDF. This can also be achieved by using the Schedule Export option on a predefined dashboard.
Once you’ve created a report, you can define scheduling and delivery information. Intelligence Reports supports eight delivery methods, including:
- AzureBlob
- Email
- FTPS
- Google Drive
- HDFS
- SFTP
- AWS - S3
- Google Cloud Storage
Ralph, the VP of marketing at NTO, wants to receive daily reports of emails that were sent so he can track email performance. He asks Paulo, NTO’s marketing specialist, to create it for him. Let’s see how he can easily create the report from scratch.
Create a Scheduled Report
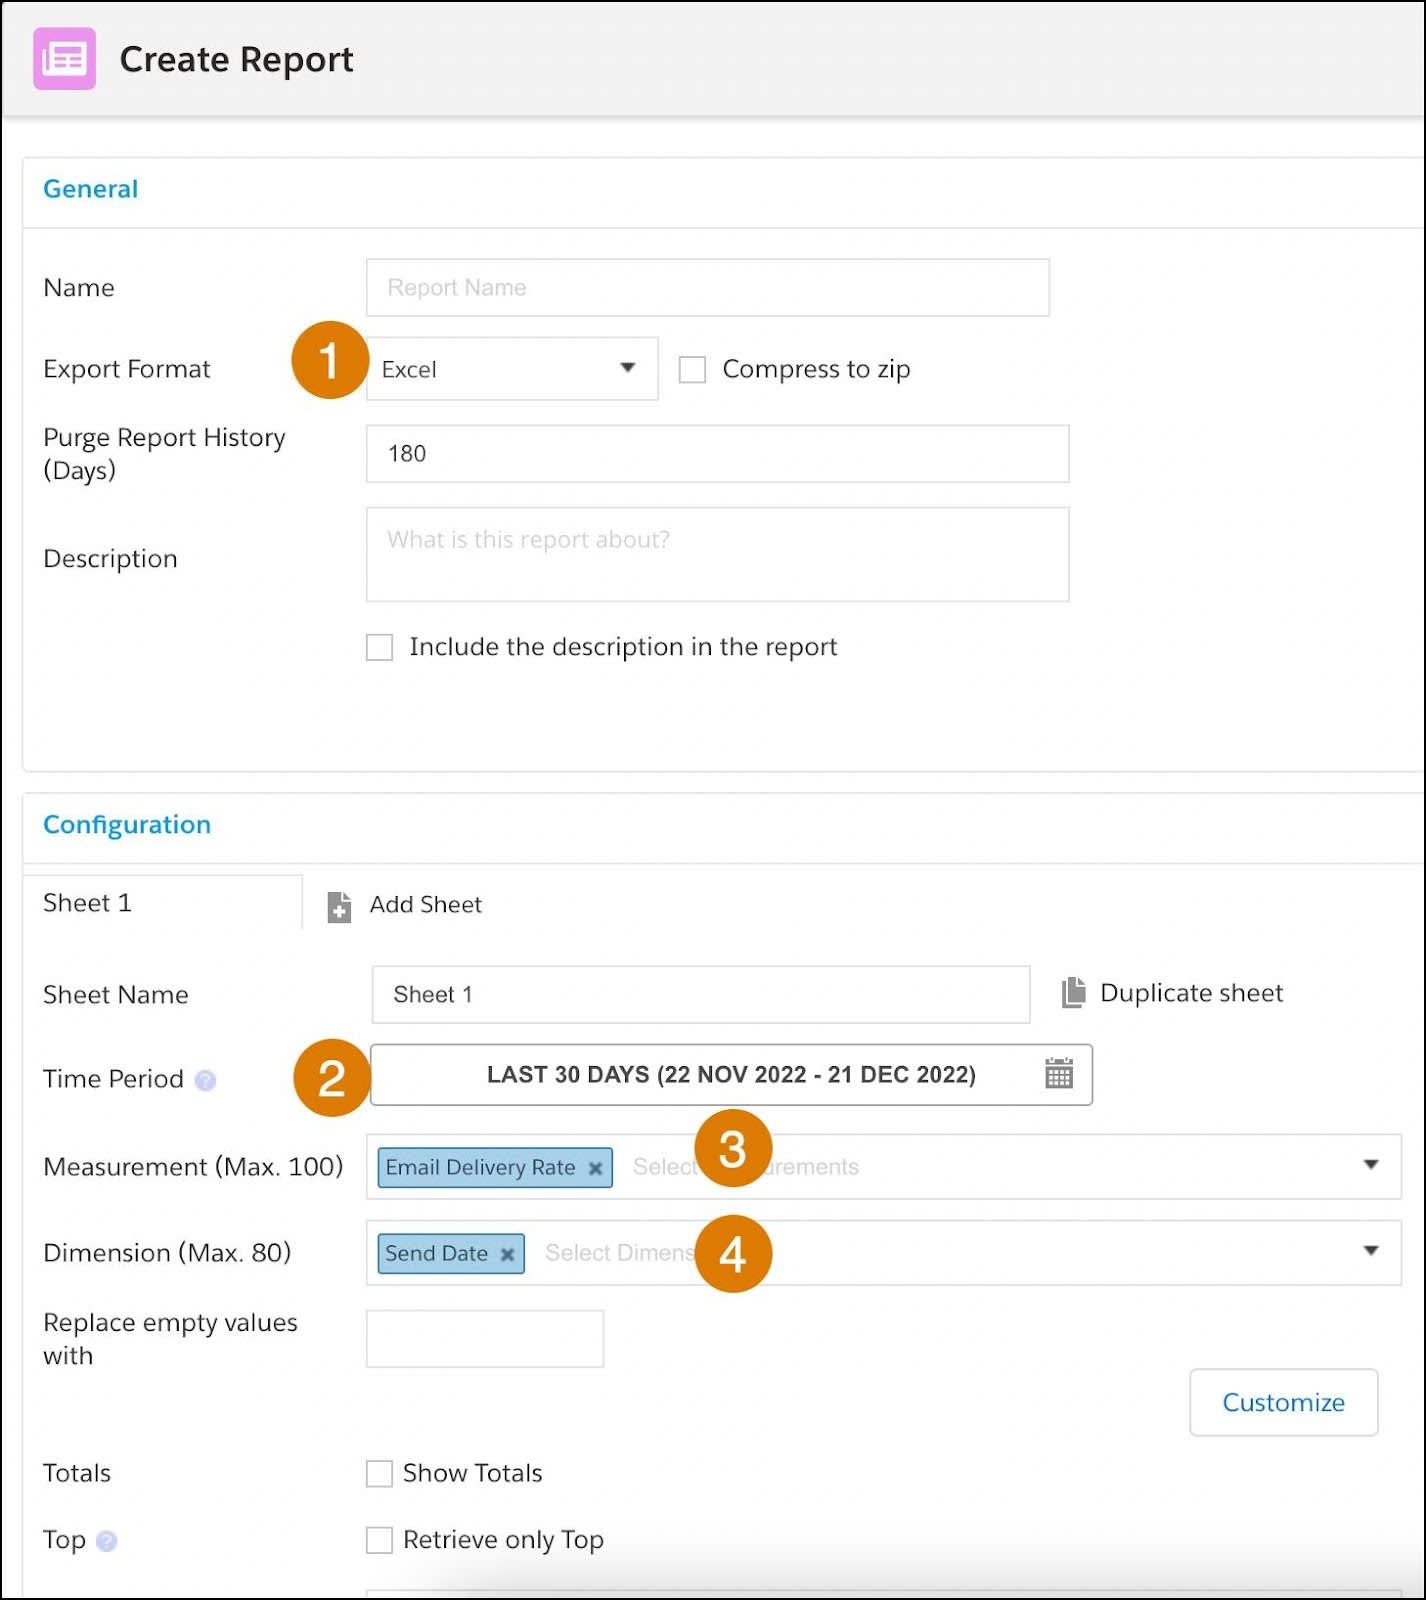
Reports are created and maintained in the Reports tab in Intelligence Reports. Once there, Paulo clicks Create New Report and defines the report as follows.
- He selects Excel as the Export Format.
- He defines the time period. By default, pulls data for the last 30 days.
- He sets the Measurement as Email Delivery Rate (since he wants to see how many emails were actually delivered).
- He sets the Dimension as Send Date (since he wants to see the emails that were sent each day).
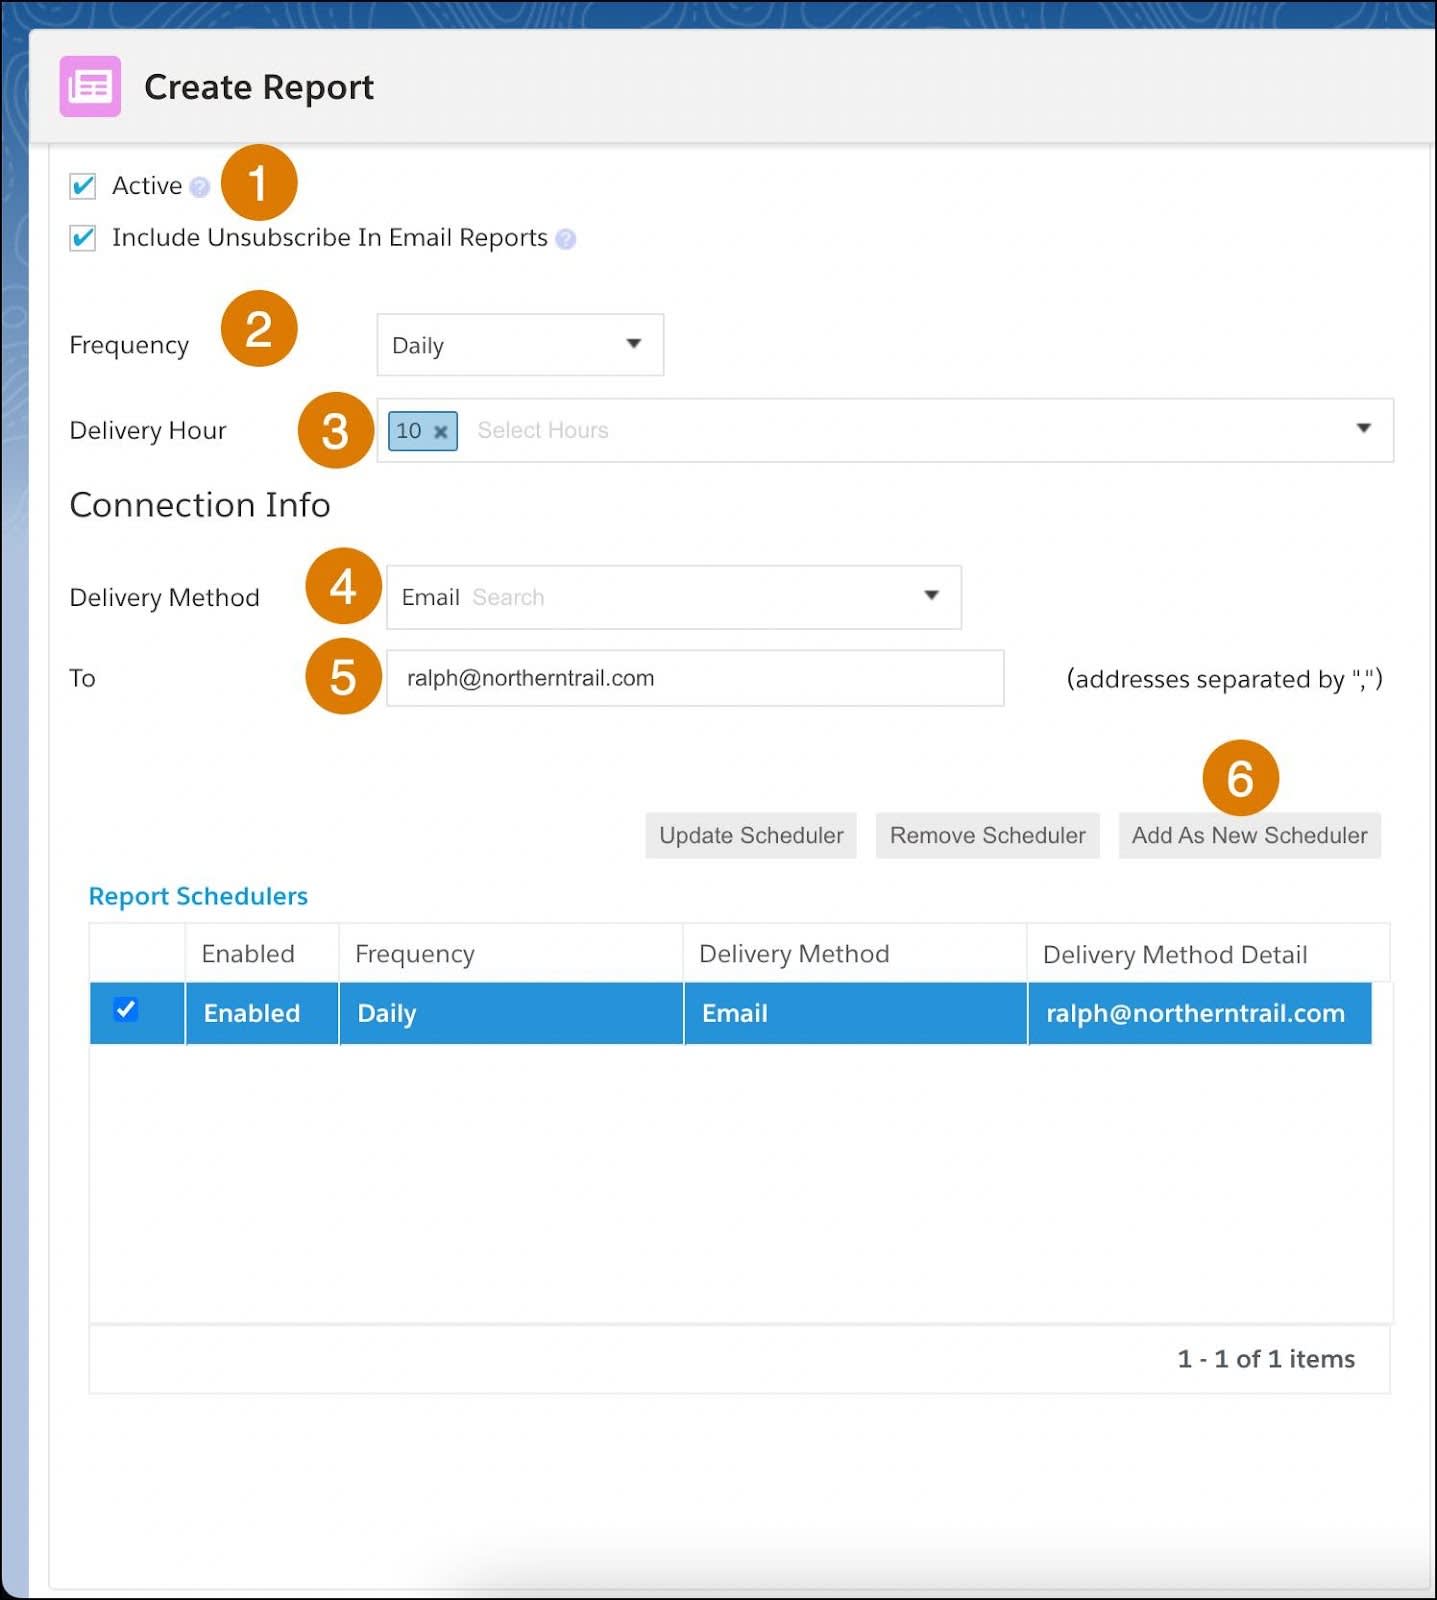
Since he wants to create a scheduled report he also performs the following steps.
- He goes to the Report Scheduling area and selects the Active checkbox to enable all the options.
- Since Ralph requested a daily report, he sets the Frequency as daily.
- He then sets the Delivery Hour as 10 PM.
- In the Delivery Method he selects Email since he wants Ralph to receive the reports via email.
- He enters Ralph’s email as the recipient.
- He clicks Add as New Scheduler to apply the schedule to the report.
View Report History
The report history log displays a list of all the times the report ran and provides information about each report execution, such as whether the run was successful, the start and end dates of the execution, and so on. You can use the report history when you want to monitor your reports—to see if any jobs failed and why, for example. You can also use report history to explore your report executions, for things like downloading report outputs.
You can find the report history log in the Reports page by clicking a report, and then clicking History. A list appears with all the report executions. Each time a report runs, a new job is executed and a new row appears in the list. From here you can edit the report’s configuration settings, delete a log from the list, refresh the report history and even run the report again. That’s it!
Sum It Up
In this module, you dove into Intelligence Reports and learned how to analyze and optimize your email, push, and journey campaign-level data. By viewing real-life scenarios, you also saw how the NTO team—Isabelle, Paulo, and Ralph—used dashboards, pivot tables, and reports to view and manage their email campaigns and use their data to its fullest potential. We can’t wait to see how you use Intelligence Reports to explore your own data!