Create Collections and Dashboard Pages
Learning Objectives
After completing this unit, you’ll be able to:
- Use dashboards in Intelligence Reports Advanced.
- Create collections and dashboard pages.
- Describe what you can accomplish with the visualization tools.
What Are Dashboards in Intelligence Reports Advanced?
Modern marketing can be complex, with so many tools, technologies, and reports available. Using Intelligence Report's unique visualization tools, you can remove the guesswork and bring all your email and journey data together into one centralized view.
Intelligence Reports Advanced provides complete visibility into your campaign performance using the data from your Marketing Cloud account. With this holistic view of your data, your teams can collaborate more effectively, and are empowered to make data-driven decisions—resulting in growth for your marketing and business efforts.
In Intelligence Reports for Engagement, you already reviewed the prebuilt dashboards. In this module, we focus on creating collections and dashboards from scratch, and editing prebuilt dashboards. These features are only available if you have Intelligence Reports Advanced premium features enabled.
The visualization process in Intelligence Reports Advanced includes three primary elements.
- Collections enable you to synergize all your data and consume it in one place. You can segment your data based on use cases or stakeholders. For example, you can create a collection for all your mobile data, or even a collection geared for executives. You can visualize, organize, and personalize your data into a collection.
- Pages are where you visualize your data. You can have multiple pages within your collection to assist you in dividing your visualizations into meaningful sections.
- Widgets are the graphic elements that appear on the page, such as pie charts, tables, and bar graphs.
Create a Collection
Once you enter Intelligence Reports and the Advanced premium feature is enabled, you’re ready to start organizing and managing your data based on your use case. The relevant data for each department is managed in separate pages or collections.
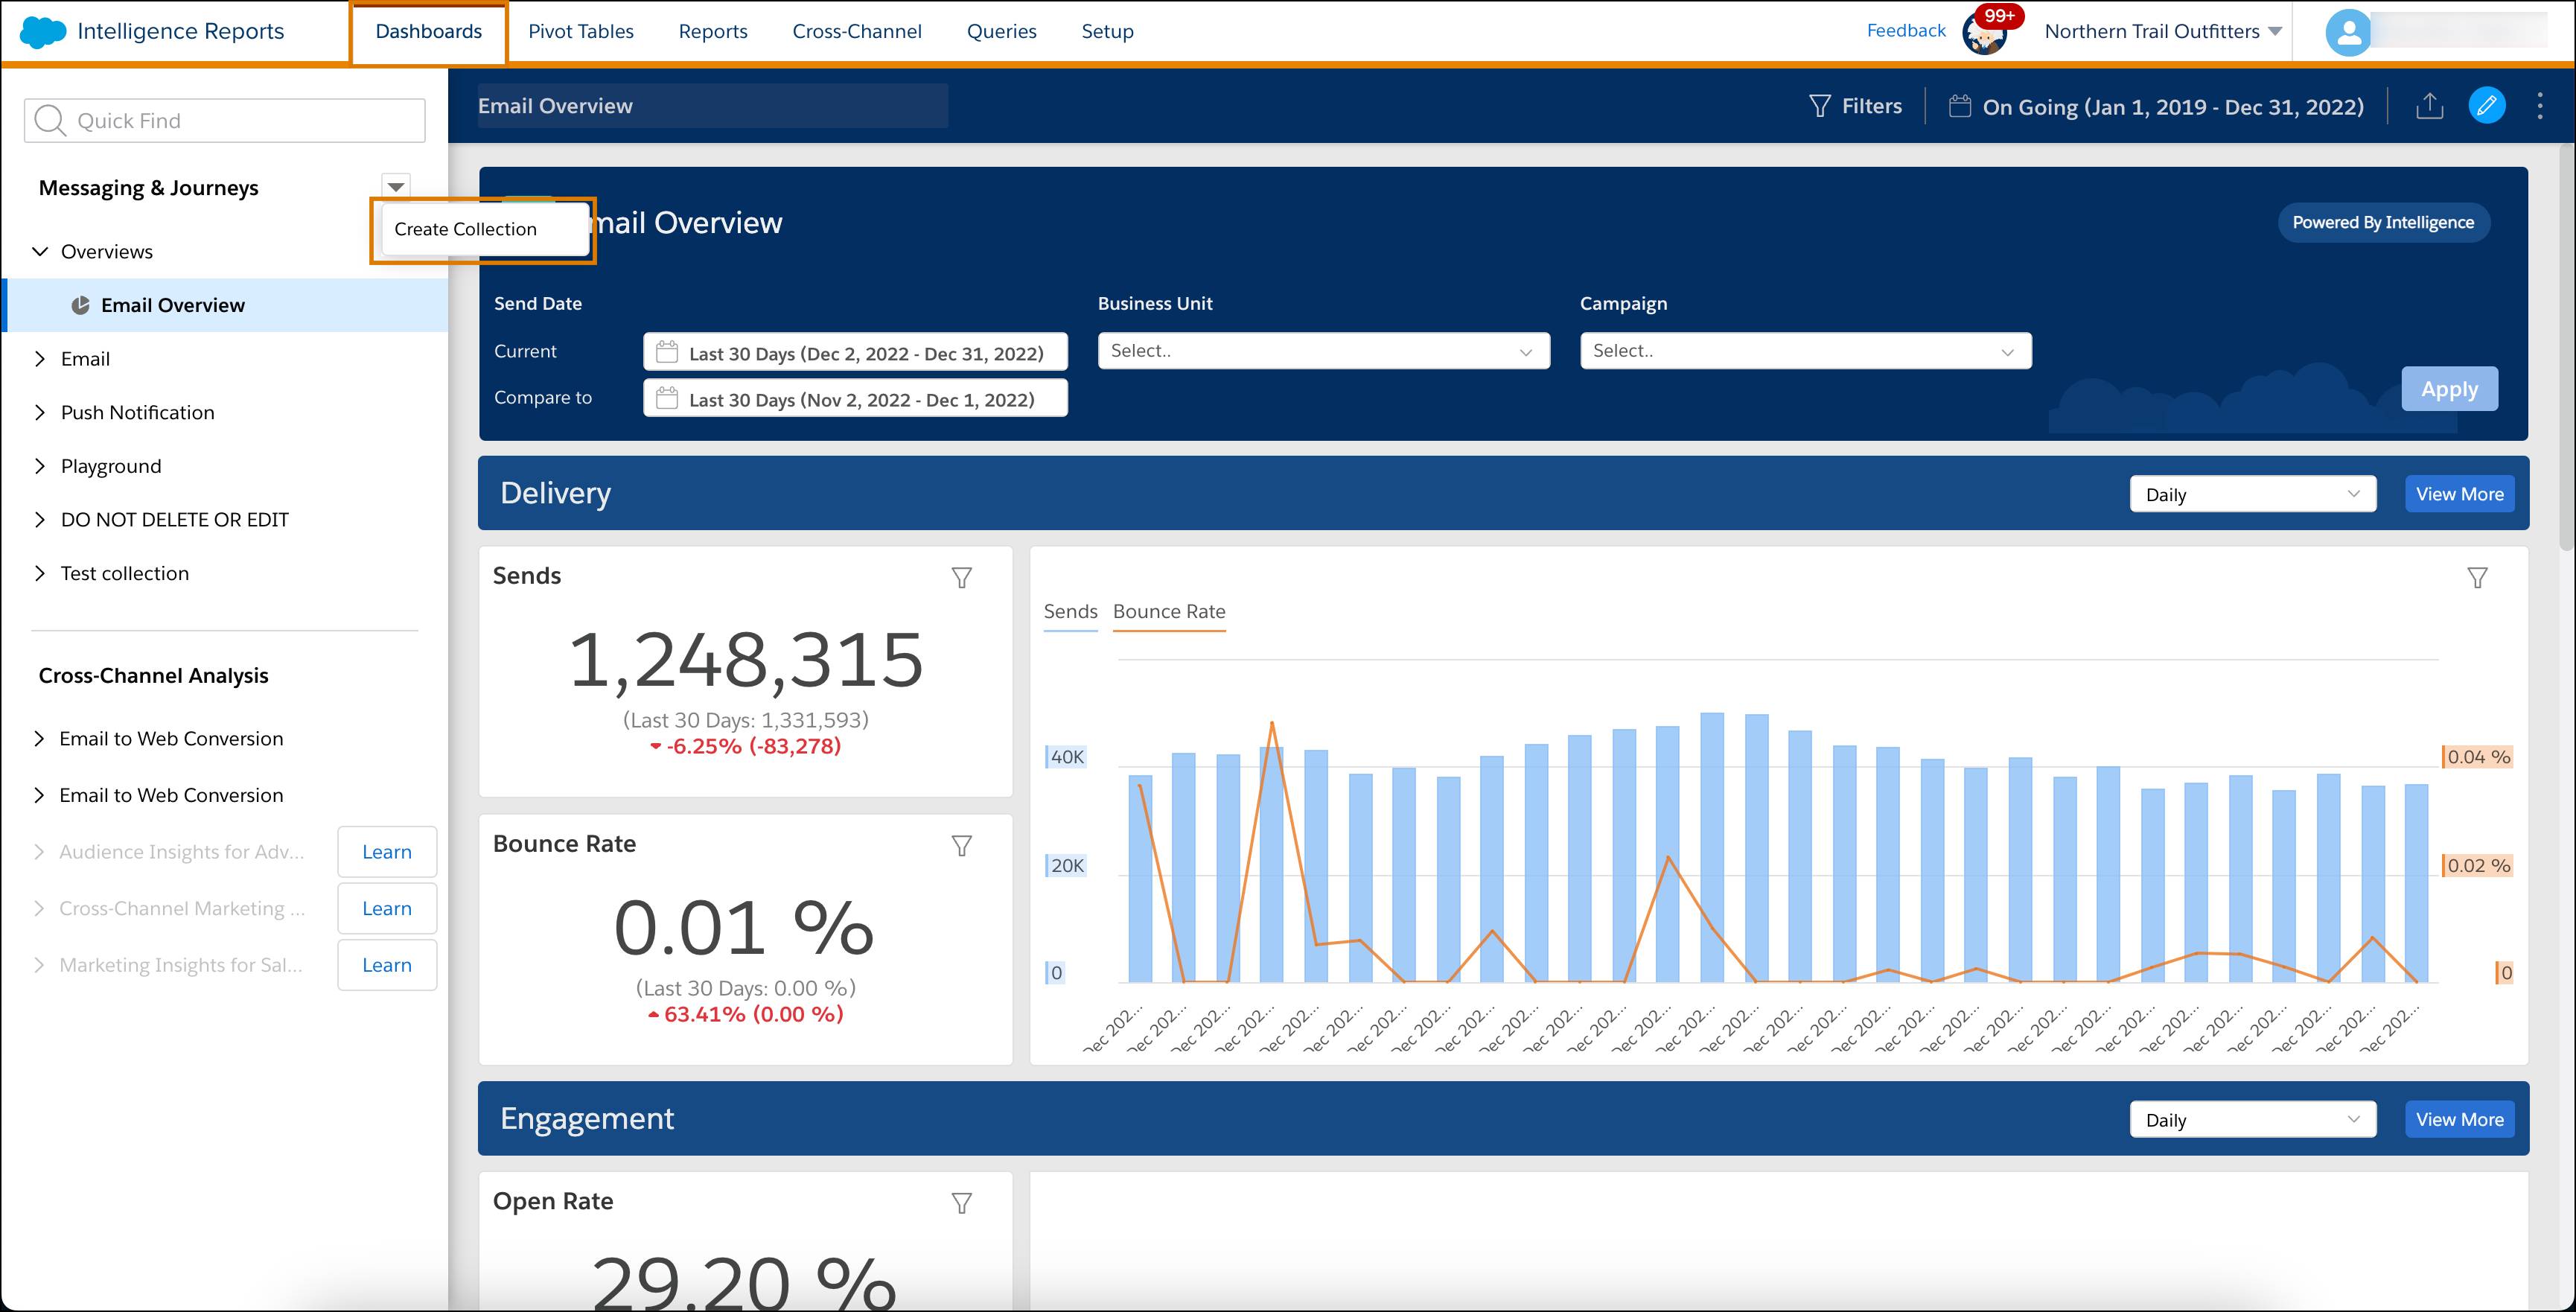
To create a collection, navigate to Dashboards, then click the dropdown arrow next to Messaging & Journeys, and click Create Collection.
Give your collection a meaningful name. You can also add a description if you want. Click Save to create the new collection.
After you save your collection, the next step is to add pages and start transforming your data using Intelligence Reports visualization tools.
Create a New Dashboard Page
After creating your collection, you’re ready to begin building your dashboard page! Before working on your new dashboard pages, it is highly recommended to consider these questions.
- What questions are you trying to answer with your dashboard?
- What do your stakeholders expect to see?
- What data do you want to present and why do you think this data is important?
- How does the data you present address all the expectations?
After planning out the scope of your page, you’ll have an easier time creating meaningful and effective work. Let’s get started!
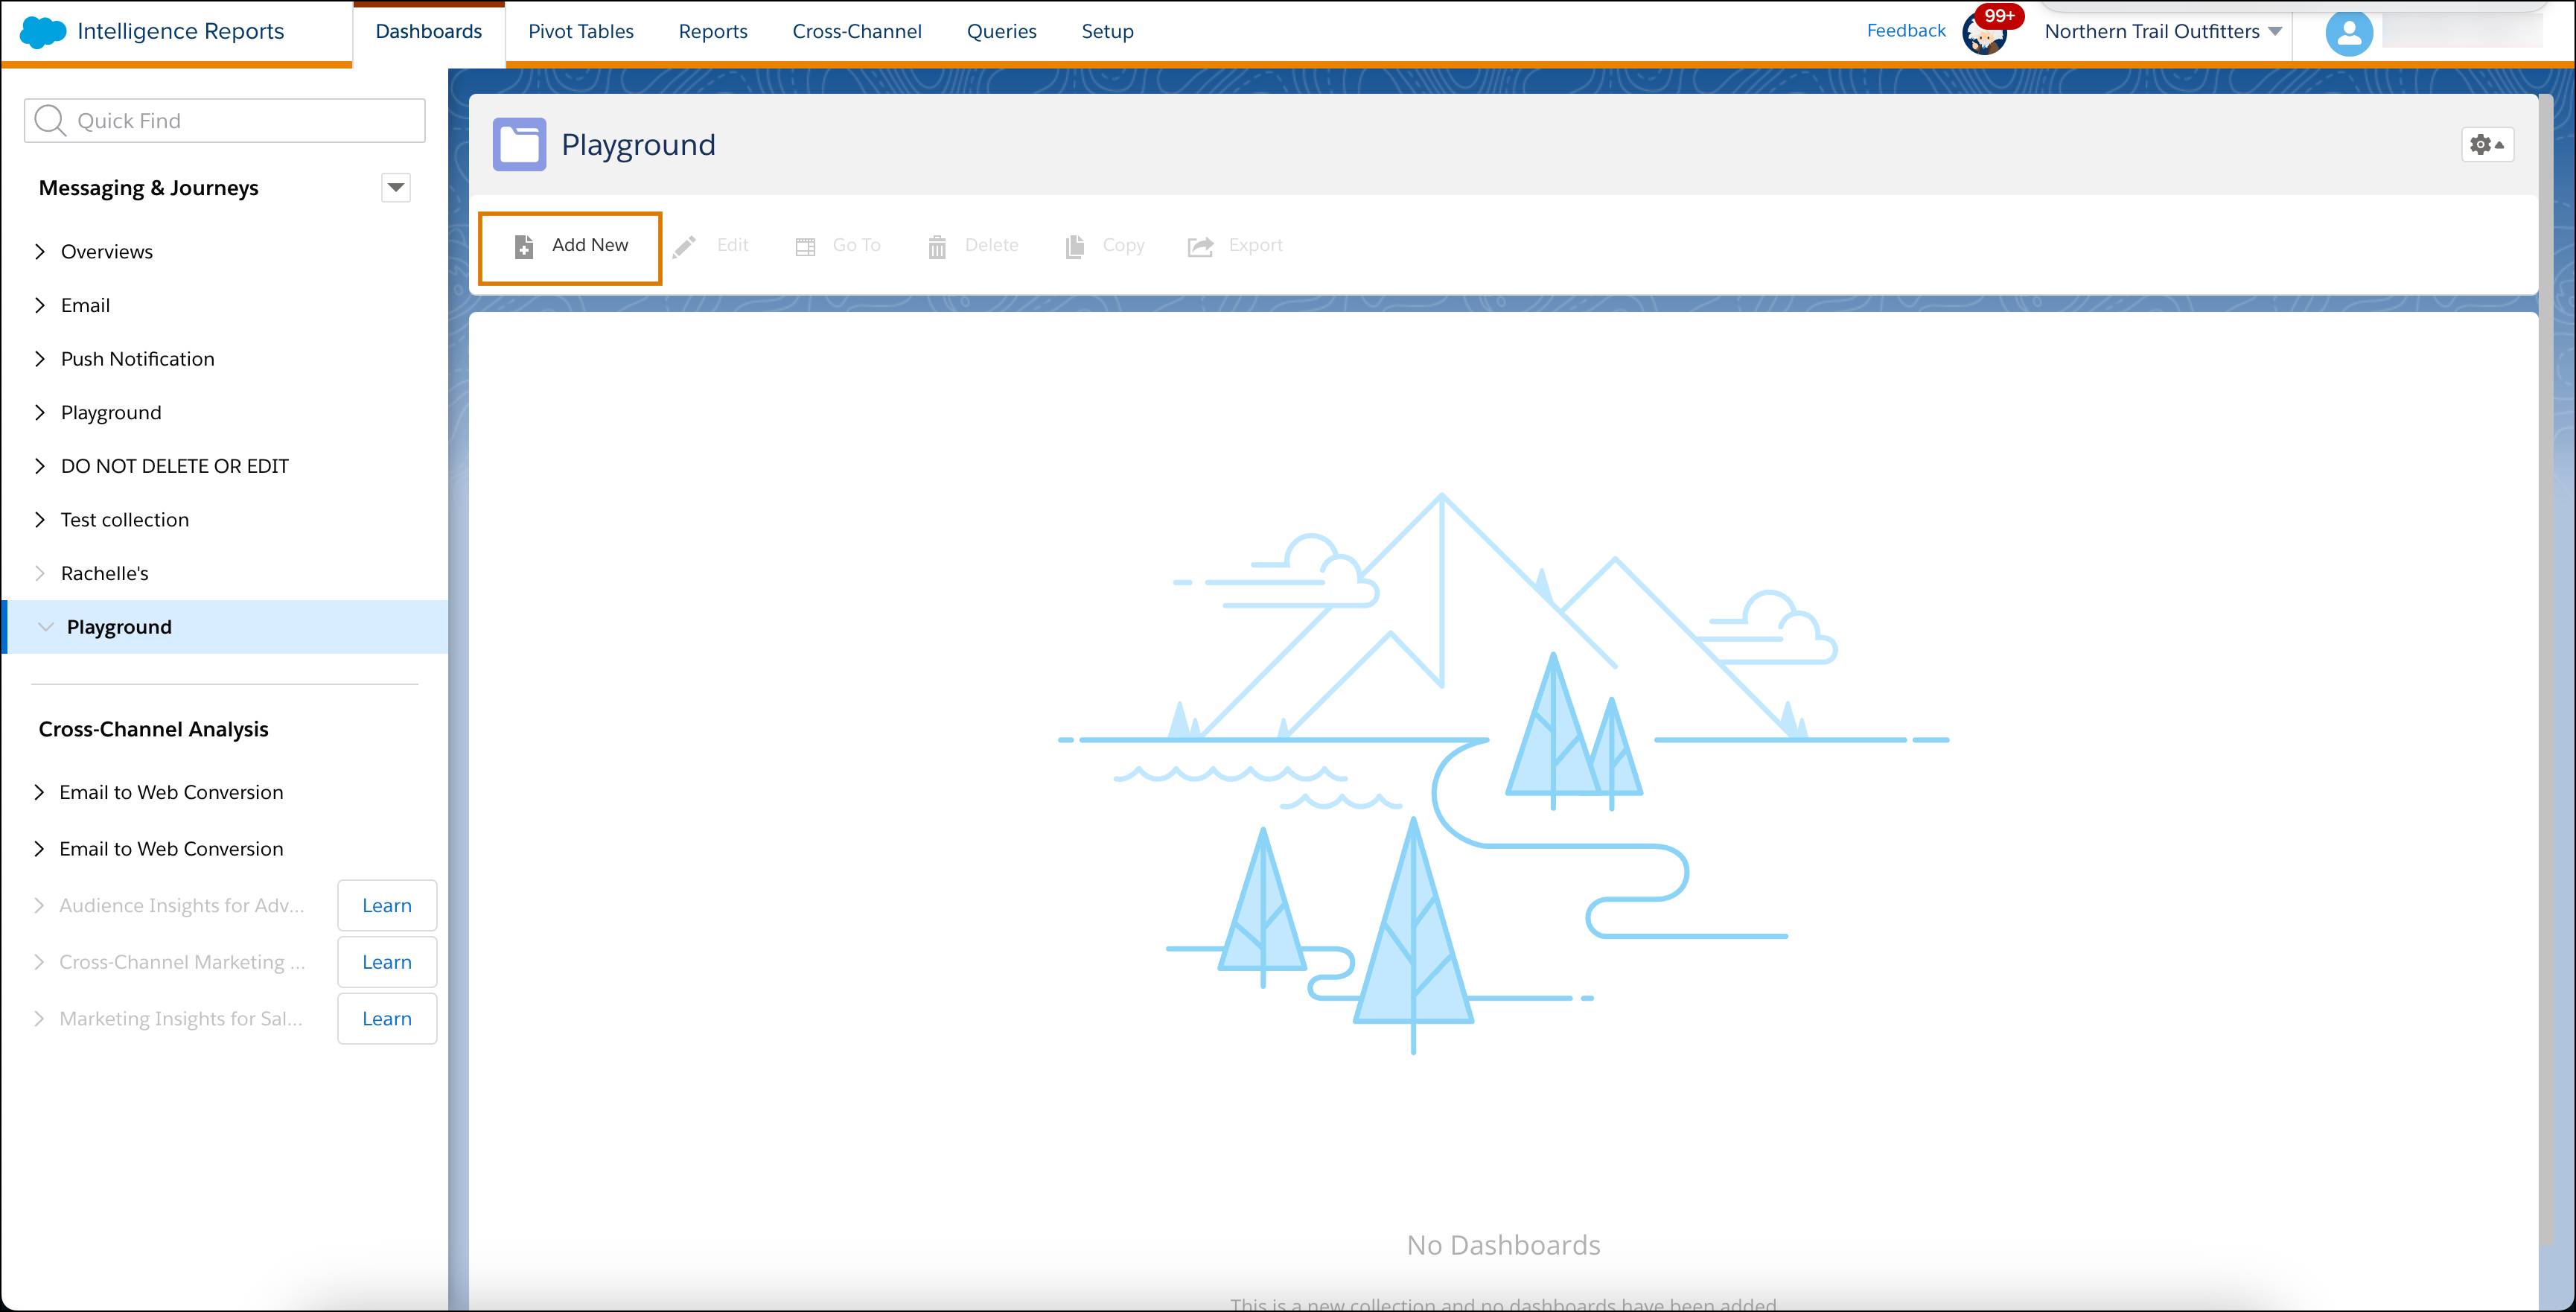
Click the collection where you want to add a page. This brings you to the collection landing page, where you can edit the pages that exist in this collection.
Click Add New to create a brand new page.
Now, you are ready to apply the basic settings to your page. To begin, click the Edit Mode button.
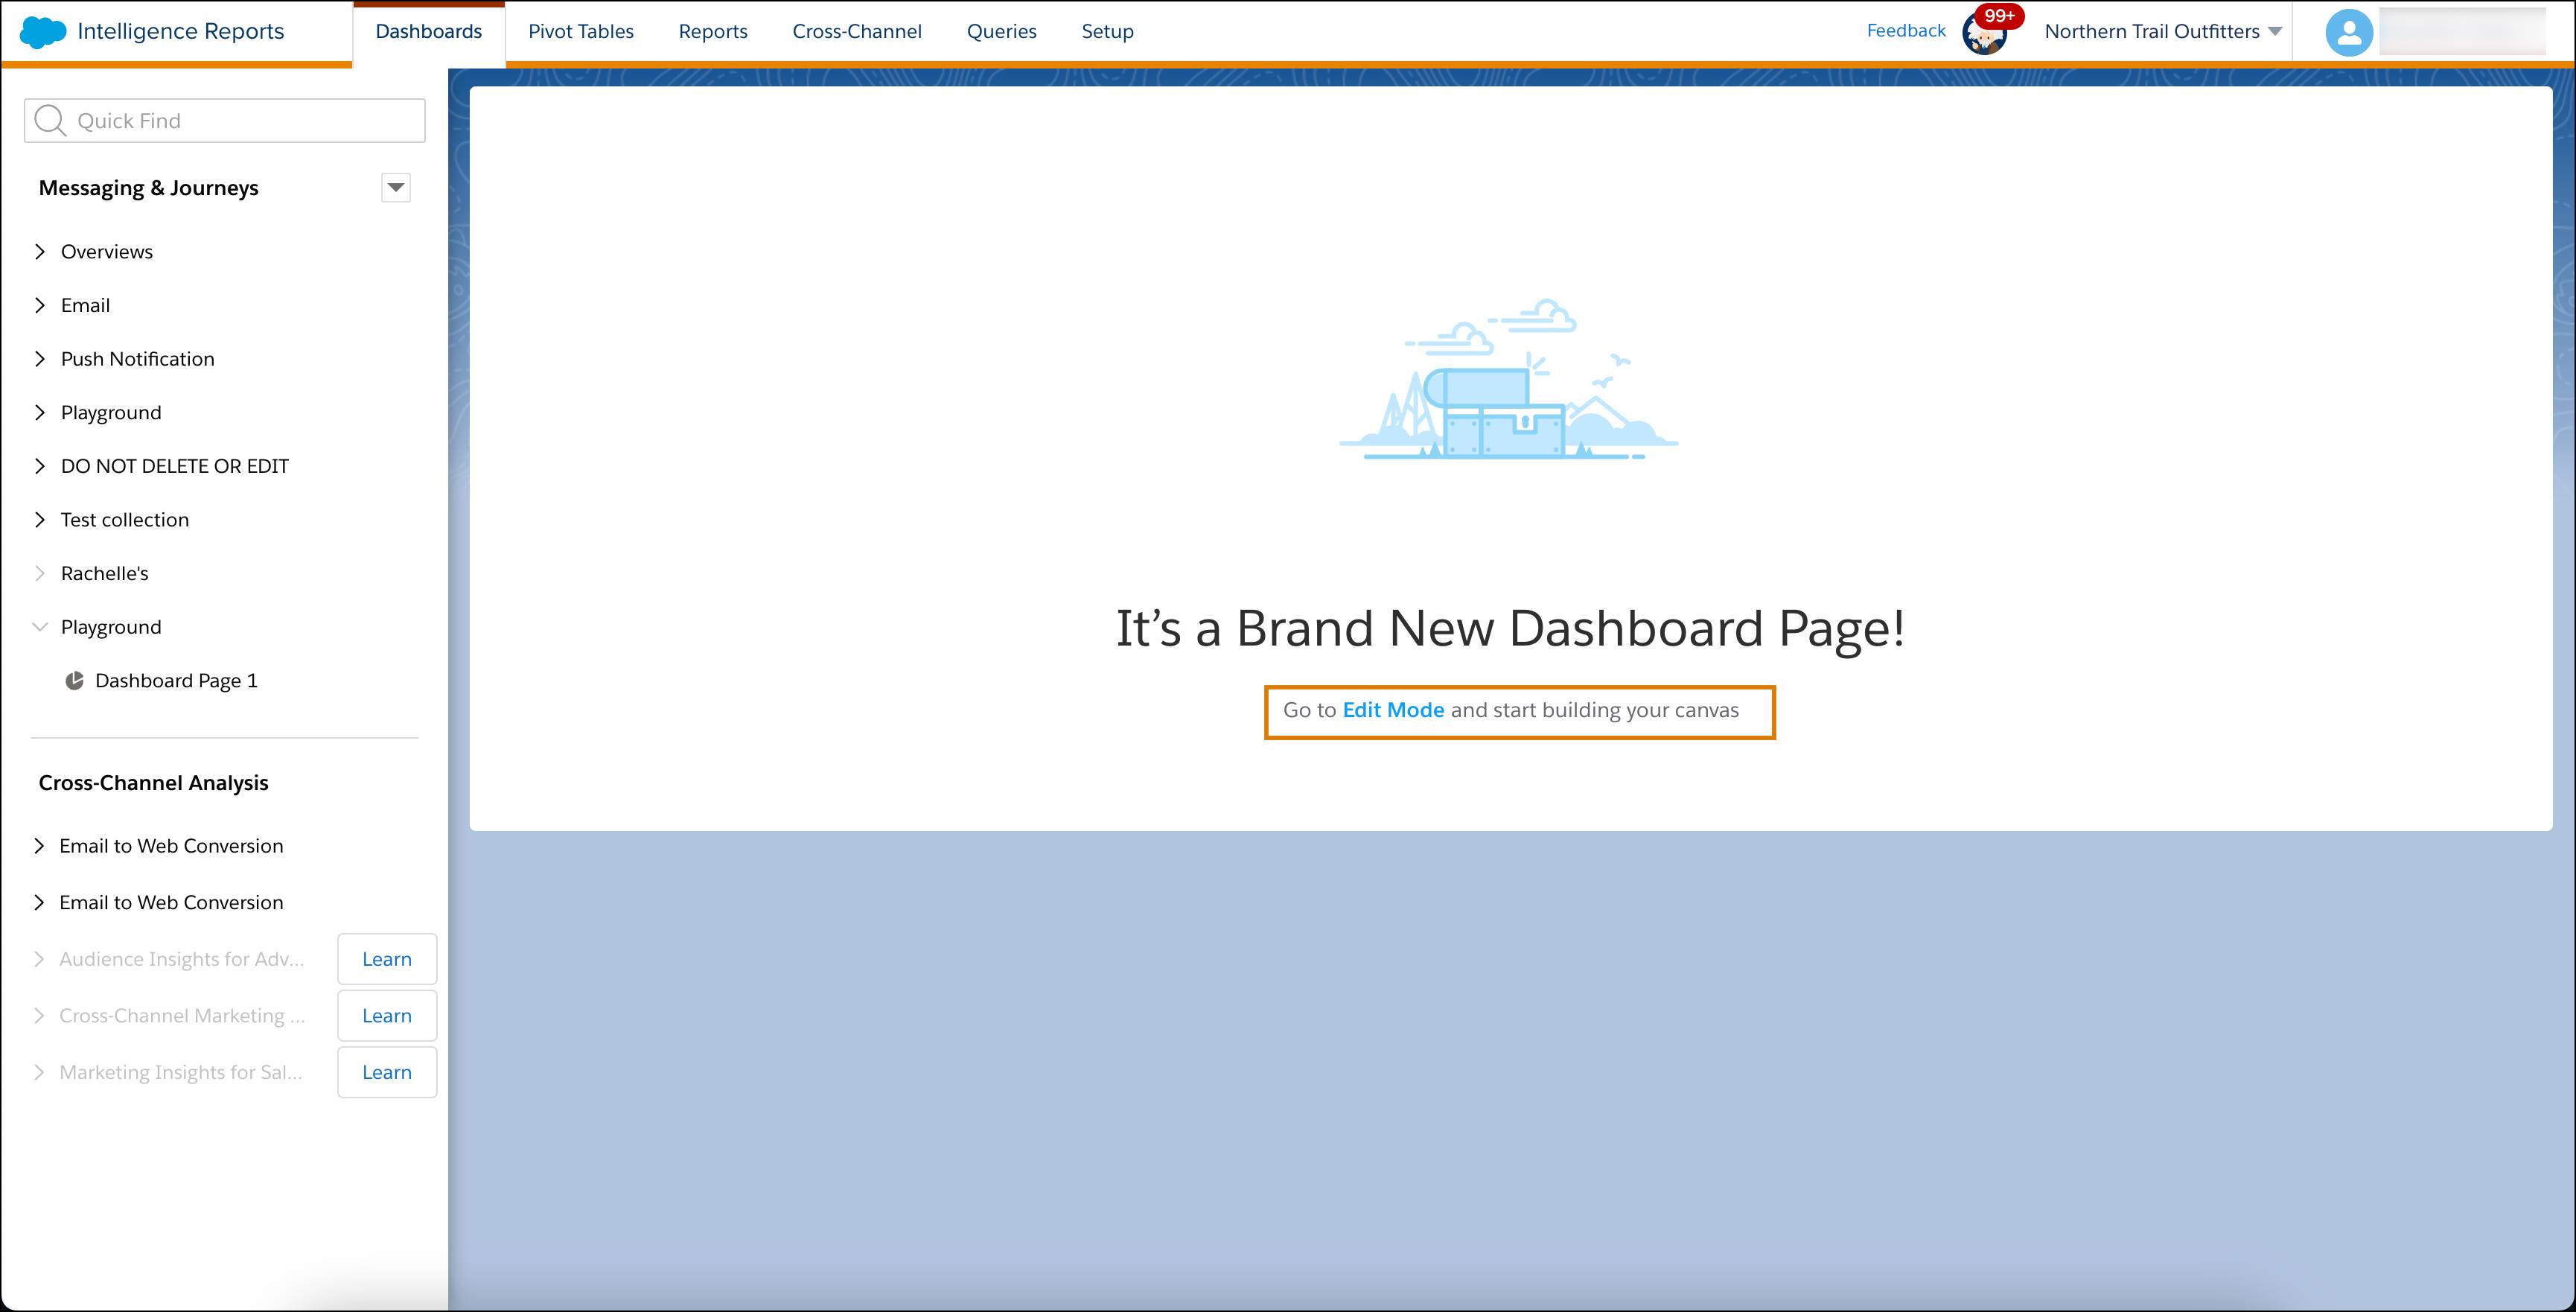
Let’s check out the options you have in edit mode.
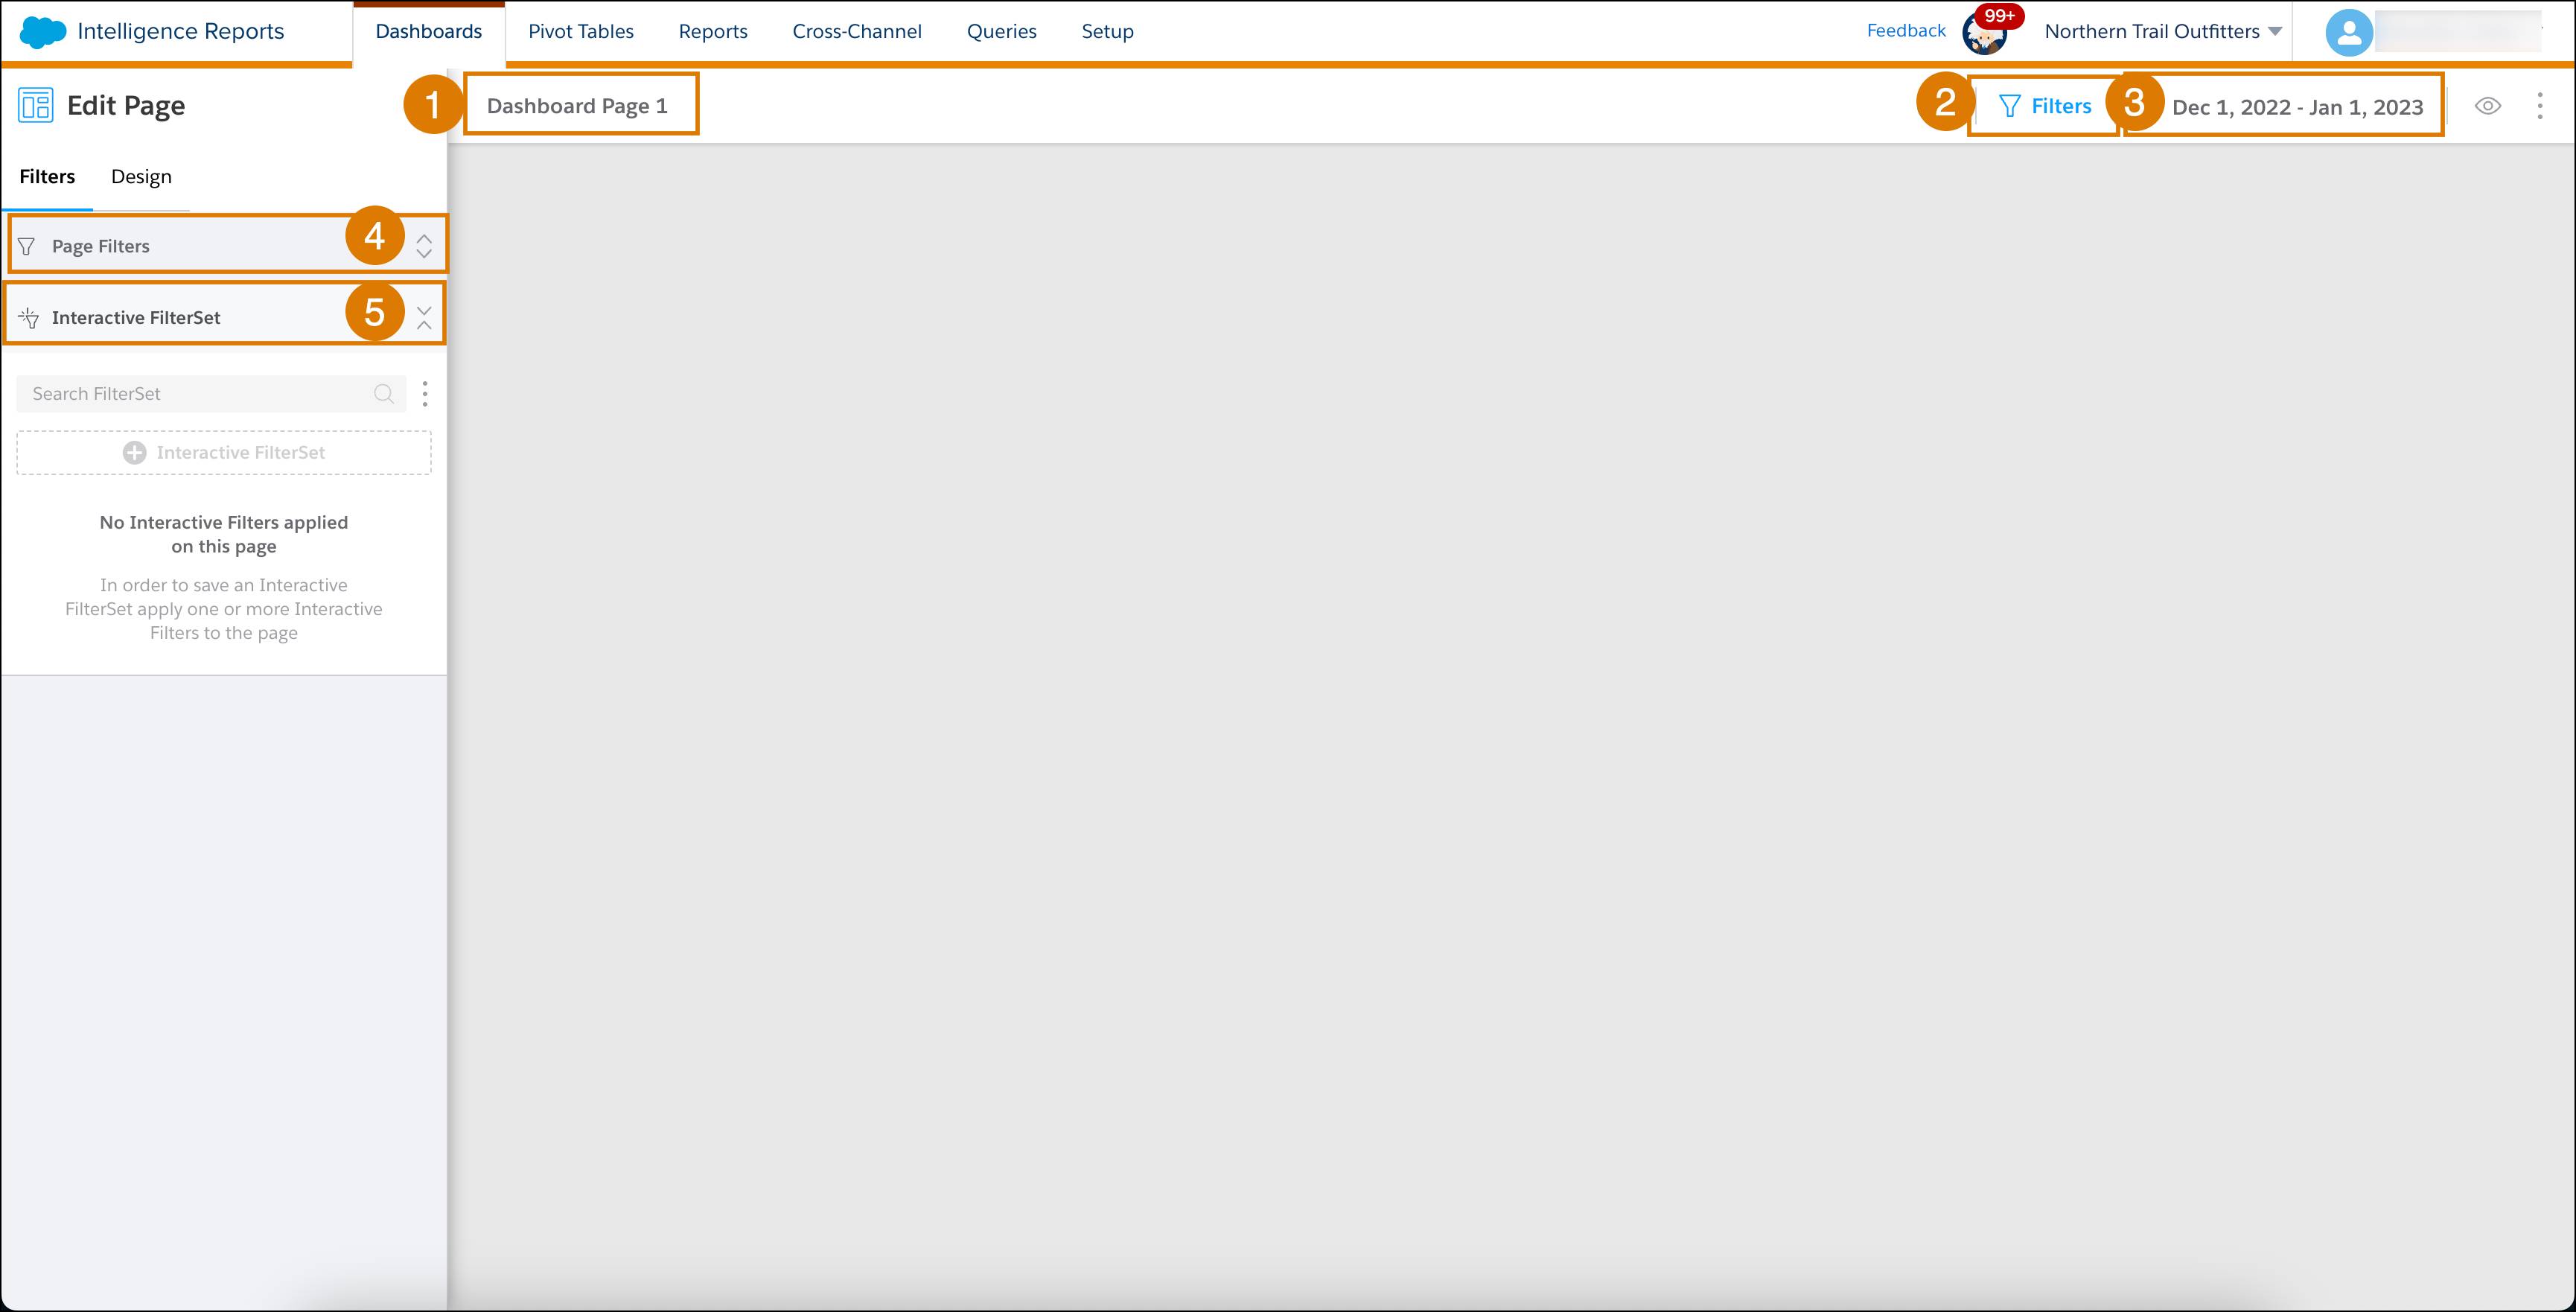
You can Name your page (1) and set the date range (3). You can also add filters to the dashboard page by clicking the Filters button (2). From the Filters tab, you can add Page Filters (4) or Interactive Filtersets (5). Page filters enable you to filter the page by any dimension, measurement, or date dimension.
Now, expand the Page Filters tab and click Add Filter. Select the field you want to filter by.
Interactive Filtersets enable you to save different views of your dashboard page by saving the selections made to the interactive filter widgets on the page. The filtersets can then be applied as a filter option within the dashboard page. Great work!
In this unit, you learned how to visualize your data, create a collection, and create a new dashboard page. Move on to the next unit and learn how to further customize your page.