Create Pivot Tables

Learning Objectives
After completing this unit, you’ll be able to:
- Explain how pivot tables work in Marketing Cloud Intelligence.
- Create a pivot table in Marketing Cloud Intelligence.
- Add data to your pivot tables.
- Analyze and validate the data in your pivot table.
What Are Pivot Tables?
Pivot tables are an effective and dynamic tool used to analyze your data. They arrange and display data in order to make it more useful. With pivot tables, you can find figures and insights quickly by having your data grouped together in a meaningful way. This makes pivot tables integral to data analysis. Marketing Cloud Intelligence pivot tables are very similar to pivot tables you may have used in other programs. So if you’re familiar with pivot tables, using them in Marketing Cloud Intelligence should be a breeze.
In Marketing Cloud Intelligence, pivot tables can be saved as reports or used to create widgets. The most common use for pivot tables is to confirm that data is being loaded correctly from the source into Marketing Cloud Intelligence. This allows you to easily check the quality of your data and see whether the values are assembling correctly. Let’s start by creating a pivot table.
In this module, we assume you’re a Marketing Cloud Intelligence user with the proper permissions to take the actions described. If you’re not a Marketing Cloud Intelligence user, that’s OK. Read along to learn how you would take the steps in the product. Don’t try to follow these steps in your Trailhead Playground. Marketing Cloud Intelligence isn’t available in the Trailhead Playground.
How to Create a Pivot Table
Pivot tables display the dimensions and measurements defined in your data model. You can sort, filter, and compare the data to ensure it is mapped correctly in Marketing Cloud Intelligence.
 Pia is an enterprise architect at outdoor gear and apparel retailer Northern Trail Outfitters (NTO). She is uploading data in Marketing Cloud Intelligence via Total Connect and wants to make sure the data is being mapped correctly. Pivot tables are Pia’s first stop to ensure her data is being mapped as intended. There are two ways for Pia to create a pivot table: via Pivot Tables or Data Streams. Here’s how.
Create a Pivot Table via Pivot Tables
In Marketing Cloud Intelligence, navigate to the Analyze & Act tab, then Pivot Tables. Click the Add New (+) icon.![Datorama Analyze & Act tab showing Pivot Tables.]](https://res.cloudinary.com/hy4kyit2a/f_auto,fl_lossy,q_70/learn/modules/data-analysis-in-datorama/create-pivot-tables-/images/3b4678c7d657cdb57e1be59f121b14fe_3396536-f-a-179-4-d-10-a-605-1-f-3543182-de-7.png)
Create a Pivot Table via Data Streams
In Marketing Cloud Intelligence, navigate to the Connect & Mix tab, then Data Stream List. Select a data stream and click Show in Pivot Table. You can now adjust your Date range (1), as well as add Dimensions and Measurements (2), and Filter (3) from the Settings Table.
The date range is automatically set according to the data stream Pia is creating the pivot table for.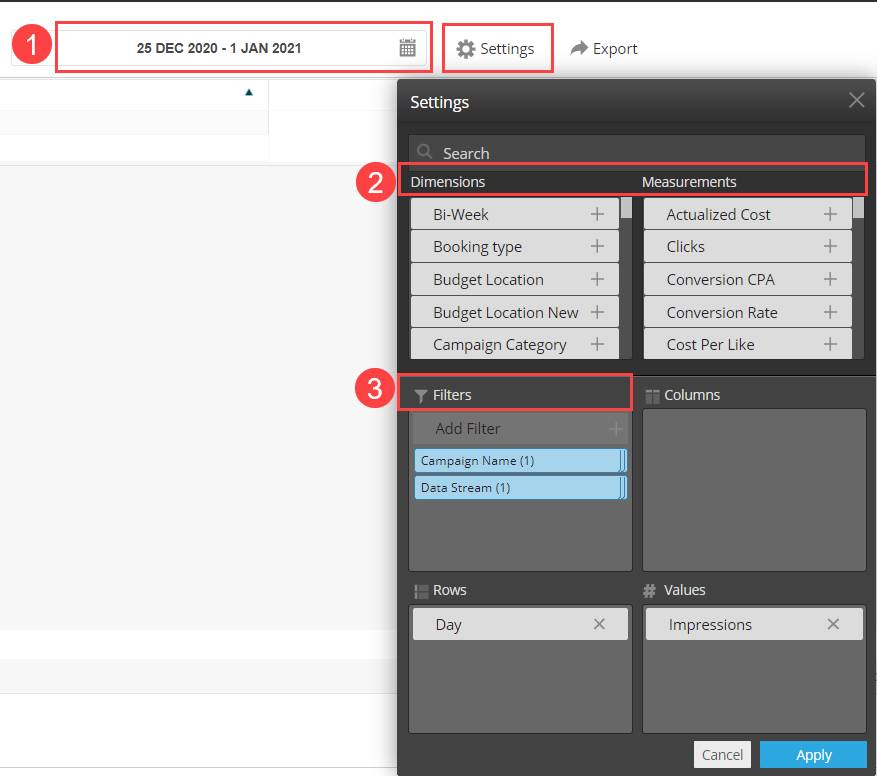
Customize and Analyze Your Data Using Pivot Tables
You’ve created your pivot table, now what? Pivot tables allow you to analyze your data from many different perspectives. You can calculate, summarize, and analyze data. For example, you can group data into categories, break down data into years and months, and filter data to include or exclude categories.
Pia is ready to customize her data, the first thing she is going to do is make sure the date range reflects the dates she is focusing on. To modify the date range, Pia can simply click the Date Range field, define the dates, and then click Apply.
Now it’s time to edit the Settings Table (1), she selects the dimensions and measurements she wants to include in the pivot table. Next, she needs to define which dimensions/measurements will represent the Rows and which will represent the Values (2). She can do this by clicking the plus sign (3) next to the chosen dimension or measurement, or drag it to the desired field. She can also use the Search (4) field to look for a specific dimension or measurement.
Here you can see that Media Buy Name was added to Rows and Impressions was added to Values.
Filter Pivot Tables
You can add a filter to your pivot table to focus on specific data, like data related to a campaign name. Pia is going to add some filters to her pivot table. From the Filters section, she clicks Add Filter. In the Filter window, she searches for the Dimension name, and selects the value she wants to filter on and clicks Save.
Here, Pia is using Campaign Name as the dimension, and the value as 2021_Q1_COMPANYNAME_CA_RTNR_US_BRAND_SP_AUDIENCE_NYC_USA.

In order to validate her data, Pia is going to compare the original file she uploaded to the pivot table results. First she makes sure that the same date range and filter values are applied to both the pivot table and the source data.
Pia applied these Date and Campaign Name filters:
- Date > 2020
- 2021_Q1_COMPANYNAME_CA_RTNR_US_BRAND_SP_AUDIENCE_NYC_USA
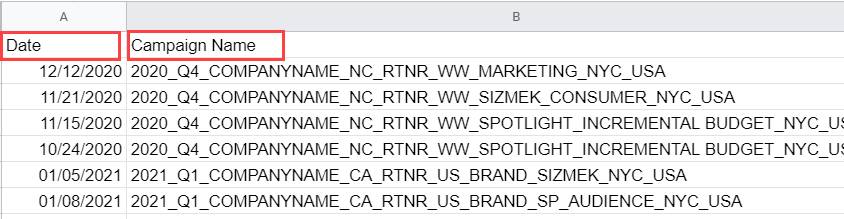
Now she compares the totals in the source file with the totals in the pivot table. If they match Pia knows the data was uploaded correctly.
In the following images, you can see that the sum of the impressions in the source file and the pivot table match.
Sum of Impressions in the Source File
Sum of Impressions in the Pivot Table

The sum of clicks also match in both places.
Sum of Clicks in the Source File

Sum of Clicks in the Pivot Table

Now that Pia has confirmed that the data is showing up correctly, she is going to name her pivot table in the PivotTable Name field and then click Save.
Now that you know how to create and customize a pivot table, you can move on to the next unit to learn how to export and share a pivot table.