Gather Feedback and Measure What Matters
Learning Objectives
After completing this unit, you’ll be able to:
- Explain why feedback is the Second Way of DevOps.
- Explain how reducing lead time enables feedback.
- List the four key DevOps metrics.

Feedback as the Key to Quality
If you completed the Salesforce DevOps with Copado badge here on Trailhead, you learned about the Three Ways of DevOps: flow, feedback, and continuous improvement. The First Way is the flow of innovation from development to end users. But just making changes isn’t enough. We also have to check that the innovation we deliver has the right impact. In this unit, we look at the Second Way of DevOps: feedback. Implementing feedback loops helps us ensure quality and find ways to improve.
With traditional IT systems, operations teams monitor servers, database load, network traffic, and more. Teams need careful measurements and access to statistical tools that help them make sense of the data and know when there’s a problem. Fortunately, Salesforce takes care of those tasks for you.
And that means you can focus your attention on getting feedback from people instead of computers. End users can tell us if changes are effective or not, so we need their input. We also need feedback on the development process itself so we can make it better.
Getting End User Feedback by Shortening Lead Time
In Salesforce DevOps with Copado, you met the Perpetual Learning team and their manager, Joan. In this module, we look at how they continue to evolve their DevOps processes.
For the third month in a row, Anitha gets assigned to a story to revise a special offers page. Perpetual Learning support agents use this page, which is very important to them, but they’re not satisfied with the previous designs.
Each time she works on the page, Anitha builds it according to specifications. But there are many support agents, and it’s easier for them to identify what they don’t like than imagine what they do like.
Anitha is frustrated, since she’s already starting work on another project. Now, just as she’s getting into the flow, she has to delay that work. And she spent a whole morning just refamiliarizing herself with the offers page code, which is complex.
The team tries to make sure developers stay busy. But because project timelines include long periods when developers are waiting for testing and release, each developer has three or four projects at any one time. That way, at least one project is always active.
But it’s inefficient for developers to spend time switching between projects, when they could use that time to deliver features that users really want. In the current system, users wait as much as a month for each new update.

Since Copado makes deployments much easier, Anitha suggests they begin making smaller, more frequent deployments. She thinks they can develop solutions more quickly if they get faster feedback from real users.
The team streamlines the approval process and begins deploying small updates every day. Support users are happy to get fast updates, and they start requesting more small changes that will improve their work. As a result, the application gradually improves.
Measuring What Matters
It’s been 3 months since Joan joined the Perpetual Learning team as manager, and now her CIO wants to know about the team’s progress.
Joan’s team has worked on multiple initiatives, and she and the CIO both want to know which ones have helped users the most. She also wants to gauge her team’s current performance and see if it’s improving.
The performance metrics that managers use can shape people’s behavior. If you rate developers on how many lines of code they produce, you’re encouraging them to write longer pieces of code. But if you rate developers on how few lines of code they produce, you reward them for squeezing more logic onto each line. Joan knows she needs to choose her metrics carefully to inspire the most useful behavior.
Now that she’s more familiar with Lean and DevOps, Joan sees the development process as a system for producing value for end users. She wants to help the team see this bigger picture and encourage teamwork toward this bigger goal.
She begins looking at end-to-end metrics like the number of stories delivered in a period of time. Since everyone on the team collaborates on each story, tracking that metric helps align them around a common goal. It also indicates how many user requests they fulfilled. If the team makes progress in that area, she knows the CIO will be pleased.
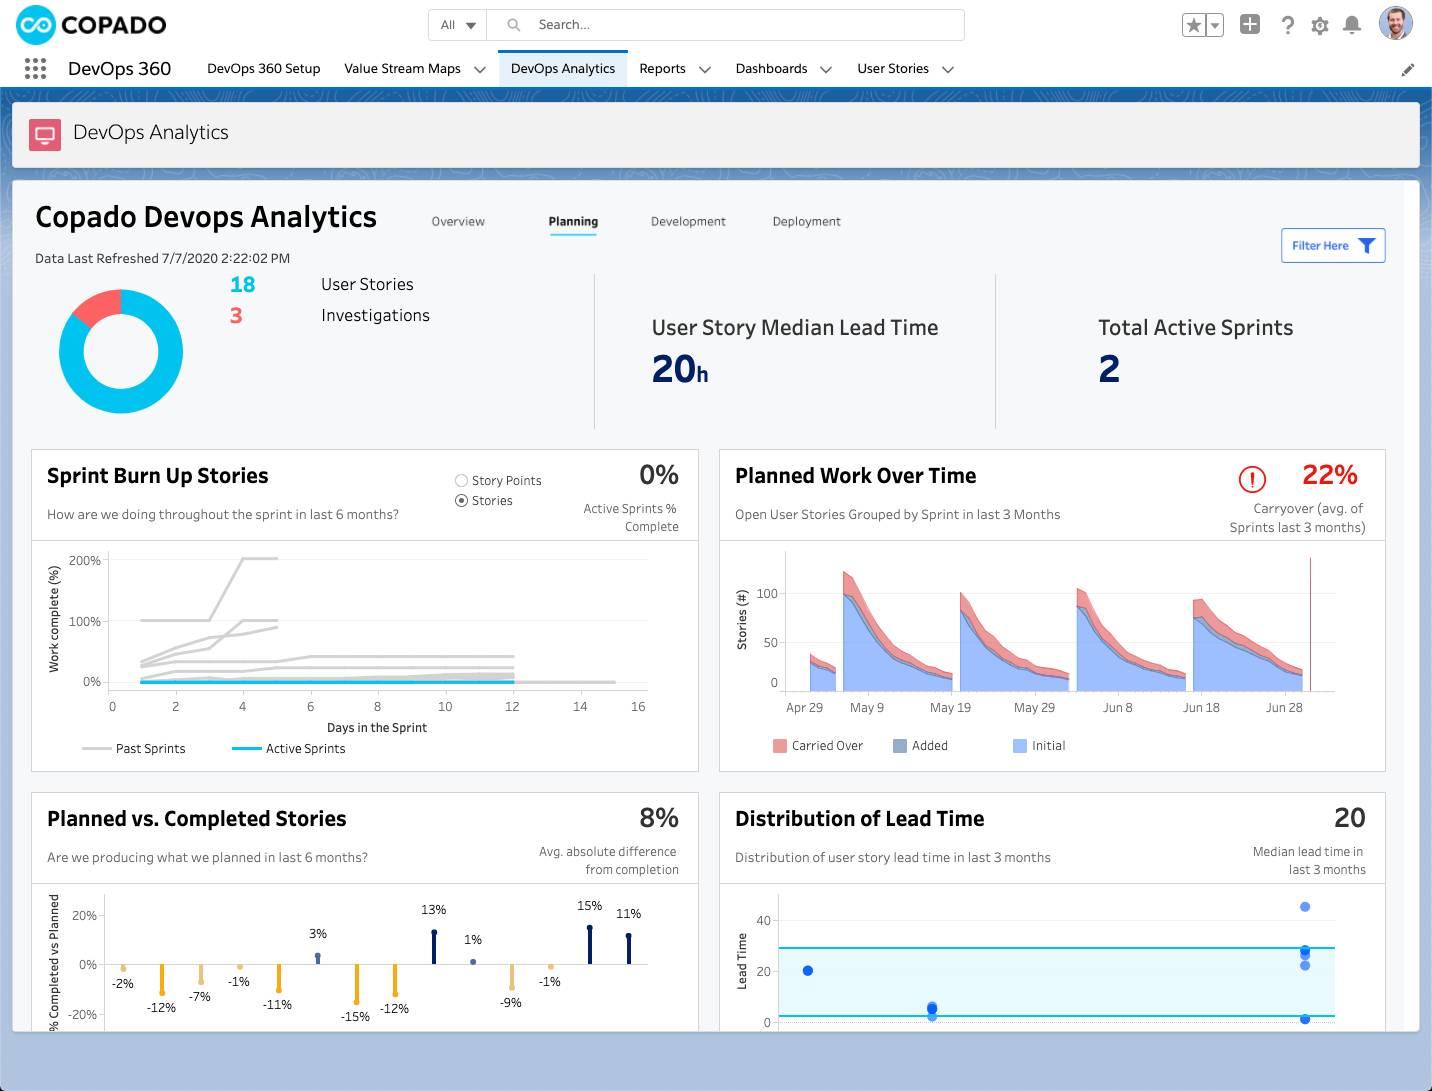
Because Joan’s team already uses Copado, Joan checks out DevOps 360, an analytics solution for the development process. DevOps 360 tracks key team metrics and displays long-term trends and acceptable levels of variation, so Joan can ignore normal fluctuations and pay attention to abnormal changes.
Joan shares these analytics with the whole team, inspiring them to set aside time in each sprint to analyze internal processes and review progress. Team members start sharing ideas for improvement, as everyone gets into the game of helping the team work more efficiently.
The Four Key Metrics
The State of DevOps Report points to four key metrics that you can use to measure the effectiveness of your development process.
- Lead time
- Deployment frequency
- Change fail percentage
- Time to restore
The first two measure speed of innovation, and the last two measure how reliably you can maintain existing systems. Together, these metrics measure both innovation and reliability: the two goals of DevOps.
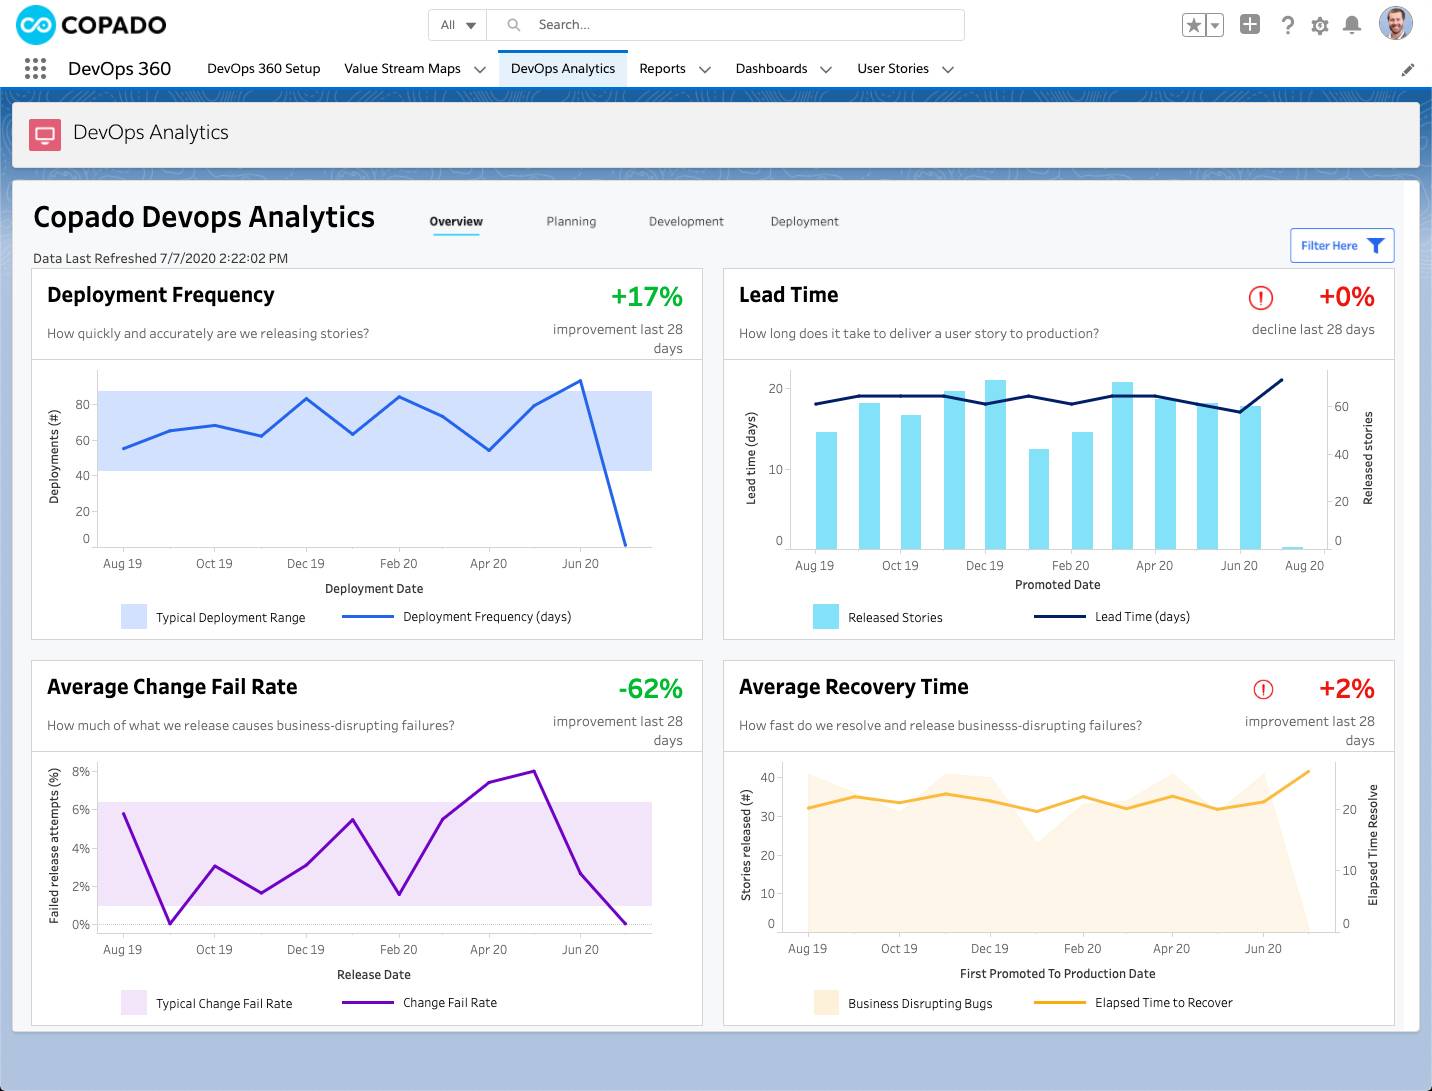
Lead Time
How much time elapses from when you receive a new feature request to when that feature is running in production? That’s your lead time, or the time it takes to plan and build plus the time it takes to test and deploy.
Since planning and building are creative processes, the time they take can vary greatly. But you can make testing and deploying to production a more predictable process.
Lead time in the State of DevOps Report measures just the post-development processes of testing and deploying. When you make process improvements that reduce waiting and inefficiency in these stages, you set yourself up to get faster feedback.
Deployment Frequency
Deployment frequency measures how often you deploy a batch of code or configuration changes to production. If you don't deploy frequently, changes pile up, making each batch larger. So increasing deployment frequency lets you decrease batch size.
In any batch of changes, some are more valuable than others. With larger, less frequent batches, valuable features wait in line with other changes, delaying the delivery of benefit. Large batches also increase risk of deployment failures and make it harder to figure out which change is responsible when a failure occurs.
Continuous delivery makes deployments less painful so teams can deploy more frequently and get faster feedback.
Change Fail Percentage
Change fail percentage measures how often you need to fix or roll back a production deployment because it causes problems for end users. One of the benefits of building on Salesforce is that you can’t “break” the platform. But you can make changes that break a custom page, don’t generate the right data, or cause errors when records are saved.
One reason some teams don’t make frequent deployments is that each change brings some risk of failure. But just as a race car can go fast more safely if it has better brakes, your team can innovate with more speed and confidence if you reduce your change failure rate. The highly effective teams identified in the State of DevOps Report have both a fast pace of innovation and a low rate of failure. Measuring failure rate encourages you to track and tune your processes to prevent or detect bugs before they impact end users.
Time to Restore
When something breaks, there’s only one metric that matters: “How quickly can you fix it?” Failure incidents are typically stressful, and they can also impact the bottom line. You want to resolve incidents quickly. The time to restore metric challenges you to resolve incidents with increasing speed.
Together, these four metrics measure the end-to-end performance of your development process. They help you focus on how your team impacts end users. Improvements to these metrics improve your organization’s ability to adapt in an increasingly competitive business world.