Integrate and Visualize Your Data
Learning Objectives
After completing this unit, you’ll be able to:
- Integrate App Analytics data with LMA data in your LMO.
- Create key performance indicators (KPIs).
- Create a CRM Analytics dashboard.
- Add a dashboard to a package record page.
Integrate App Analytics Data in Your LMO
Awesome—Robert created an App Analytics request and retrieved package summary data. He even created Apex triggers to automate requests and retrievals. But before he celebrates, he still has work to do.

Robert’s next step is to integrate his automated App Analytics data with his LMA data in CRM Analytics. Continue following along with him in your own LMO.
CRM Analytics Setup
Before you use CRM Analytics, create a permission set in your LMO that grants the CRM Analytics Integration User access to the LMA data.
- Licenses
- Packages
- Package Versions
- For help creating this permission set, read Control Access to Salesforce Objects and Fields.

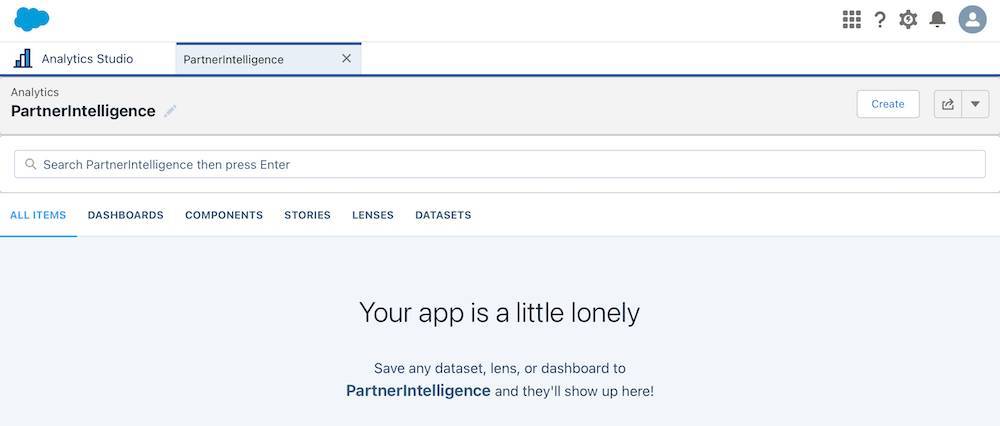
Create a CRM Analytics App
Ready to use CRM Analytics? Super. If you’re following along with Robert, create a CRM Analytics app in your LMO. Apps allow users to organize and control sharing of their datasets, lenses, and dashboards.
- From the App Launcher
 find and select Analytics Studio.
 - In Analytics Studio, click Create.
- Select App.
- Click Create Blank App and then click Continue.
- For app name, enter
PartnerIntelligence. - Click Create.
Import App Analytics Data into CRM Analytics
Next, create a dataset to store your App Analytics CSV file. If you’re following along with Robert, find the PackageSummaries3Months CSV file that you downloaded in the previous unit.
- In Analytics Studio, click Create, and then select Dataset.
- Click CSV File as the source of the data.
- In the New Dataset screen, click Select a file or drag it here.
- In the file-selection window that opens, select the CSV file that you downloaded and then click Open (or the correct button in your operating system) to upload the file.
- Click Next.
- Name your dataset
PackageSummaries3Months, select your app, and then click Next.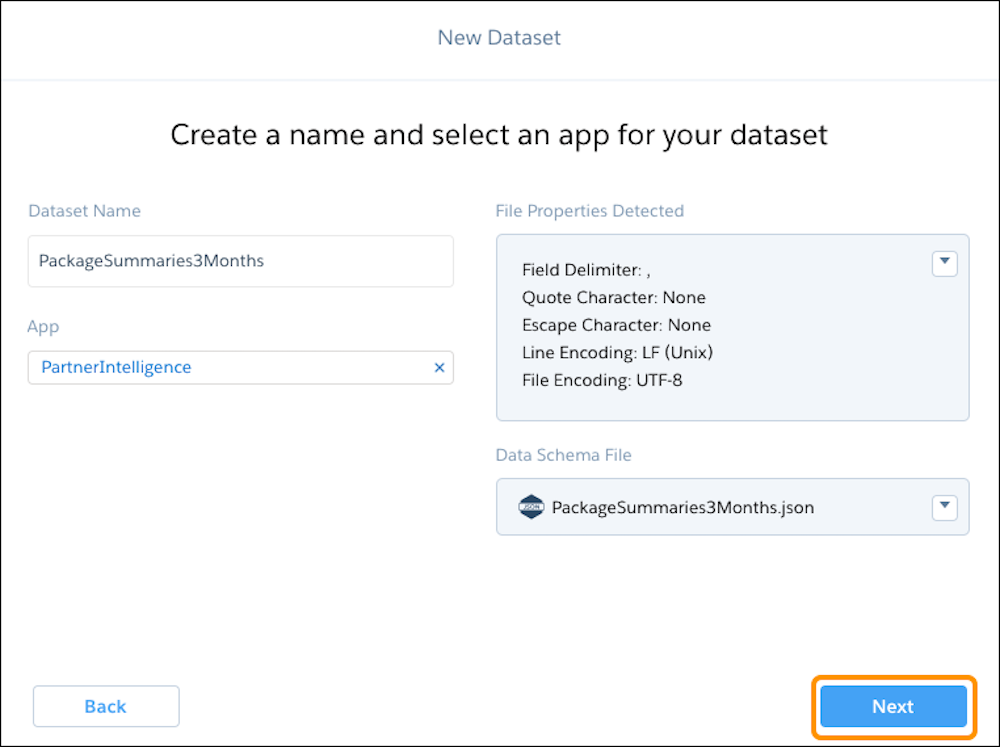
- In Edit Field Attributes, preview your data, then click Upload File.
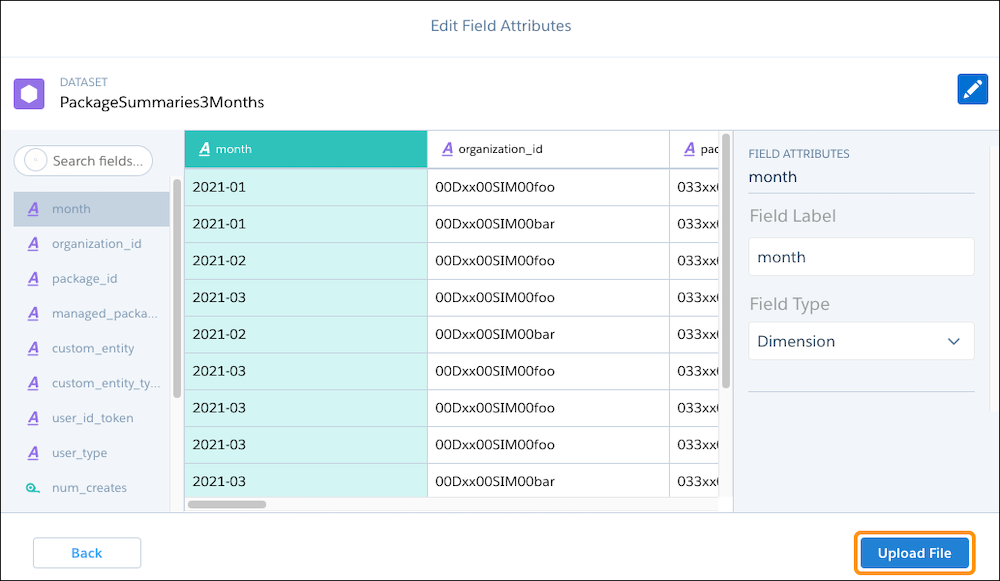
The upload begins and a new dataset is created—it can take a while. Go enjoy your favorite beverage while you wait.
Create a Dataflow
Next, associate your LMA packages in the App Analytics logs. To do this, build a CRM Analytics dataflow. For more information on working with dataflows, see Integrate and Prepare Data for Analysis.
Follow these steps.
- Click CRM Analytics Studio.
- Under Browse, click Data Manager.
- Click Manage Dataflows.

- Click Dataflows & Recipes.
- Click Dataflows.
- Click Create Dataflow.
- Name it
PackageSummary_LMAand click Create. The PackageSummary_LMA dataflow page opens.
- Click edgemart icon (A) and create a node with these specifications:
Node Name:digest_PackageSummariesPackageSummaries3Months - Click sfdcDigest icon (B) and create a node with these specifications:
Node Name:digest_PackagessfLma__Package__c - Click Select Fields and select
id,sfLma__Package_ID__c, andName. - Click Create.
- Click augment icon (C) and create a node with these specifications:
Name:join_Packages_PackageSummaries
Left Source:digest_PackageSummaries
Left Key:package_id
Relationship:Package
Right Source:digest_Packages
Right Key:sfLma__Package_ID__c
Right Fields:Id,Name,sfLma__Package_ID__c - Click sfdcRegister (D) to register the dataset with these specifications:
Node Name:register_PackageSummariesWithLMA
Source Node:join_Packages_PackageSummaries
Alias:PackageSummariesWithLMA
Name:PackageSummariesWithLMA - Click Create.
When complete, your dataflow may look a little different, but your nodes and elements are auto-joined like this.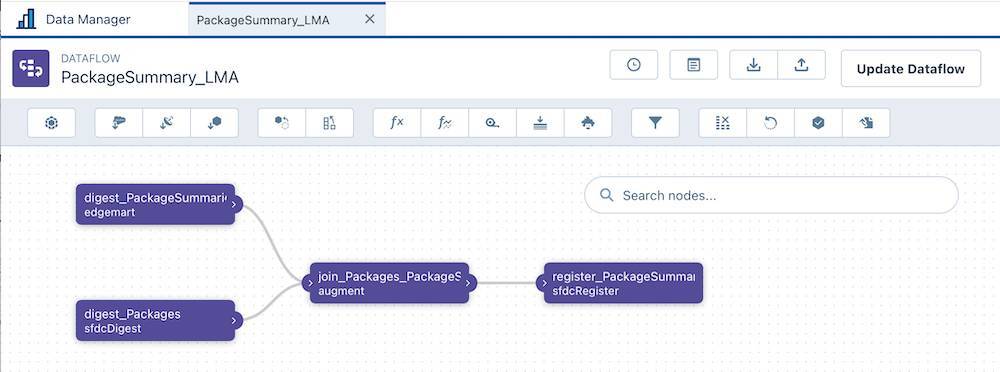
- Click Update Dataflow.
- Click Update Dataflow again.
- Click Run Dataflow.
- Click Go To Data Monitor.
Visualize Your Data Using CRM Analytics
Remember those business questions that Robert and Leung discussed earlier in this module? Now is the time to revisit those because we’re all set to work on lenses, KPIs, and dashboards.
Follow along with Robert while he creates these KPIs and visualizations.
| KPIs | Visualizations |
|---|---|
|
Daily and monthly active users |
Bar chart of active users by day and month within a quarter |
|
Count of Create, Read, Update, and Delete (CRUD) actions per user |
Bar chart of CRUD actions by user by month |
For each KPI, Robert creates one lens. A lens is a visualization of data in a dataset. He uses the lens to explore data graphically and to build queries for a dashboard. Finally, Robert creates his dashboard using his dataset and new lenses.
Ready to follow along with Robert in your own LMO? Let’s go!
Create a CRM Analytics Dashboard
- Return to CRM Analytics Studio by clicking the
 and selecting App Launcher.
 - Click the again and select Analytics Studio.
- Click Create and select Dashboard.
- In the Create Analytics Dashboard window, click Create Dashboard from Template.
- Select Details Dashboard and click Continue.
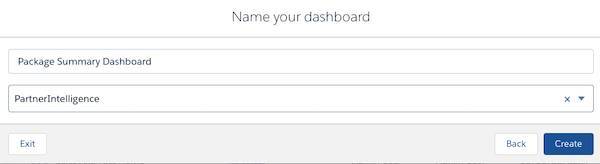
- Name your dashboard
Package Summary Dashboard. - Select the PartnerIntelligence app.
- Click Create.
Create a Lens
- Click Analytics Studio to return to the Analytics Studio home page.
- Under Browse, click All Items.
- Click DATASETS, and then click the PackageSummariesWithLMA dataset.
- In the New Lens tab, click the Charts icon
 .
. - Select the Column chart icon
 .
. - Under Bar Length click Count of Rows (not the down arrow next to the words).

- Click Unique, and then select user_id_token.
- Under Bars, click Add a group (+), and then select month.
- Under Bar Length, click the dropdown arrow
 next to Unique of user.id.token, and select Sort Descending.
 - Click Save to save your lens.
- In the Save window that opens, for the Name of your new lens, enter
Monthly Active Users. - In the App list, select PartnerIntelligence.
- Click Save.
- Click Clip to Designer
 .
. 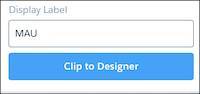
- For Display Label, enter
MAUand then click Clip to Designer. This action adds the newly created lens to your open dashboard.
Add a Visualization to Your Dashboard
- Click the Package Summary Dashboard tab.

- Click Analytics Studio to return to the Analytics Studio home page.
- Under Browse, click All Items.
- Click DATASETS, and then click the PackageSummariesWithLMA dataset.
- In the New Lens tab, click the Charts icon.
- Click
 and then Save to save your dashboard.
 - Click Preview to preview your dashboard.
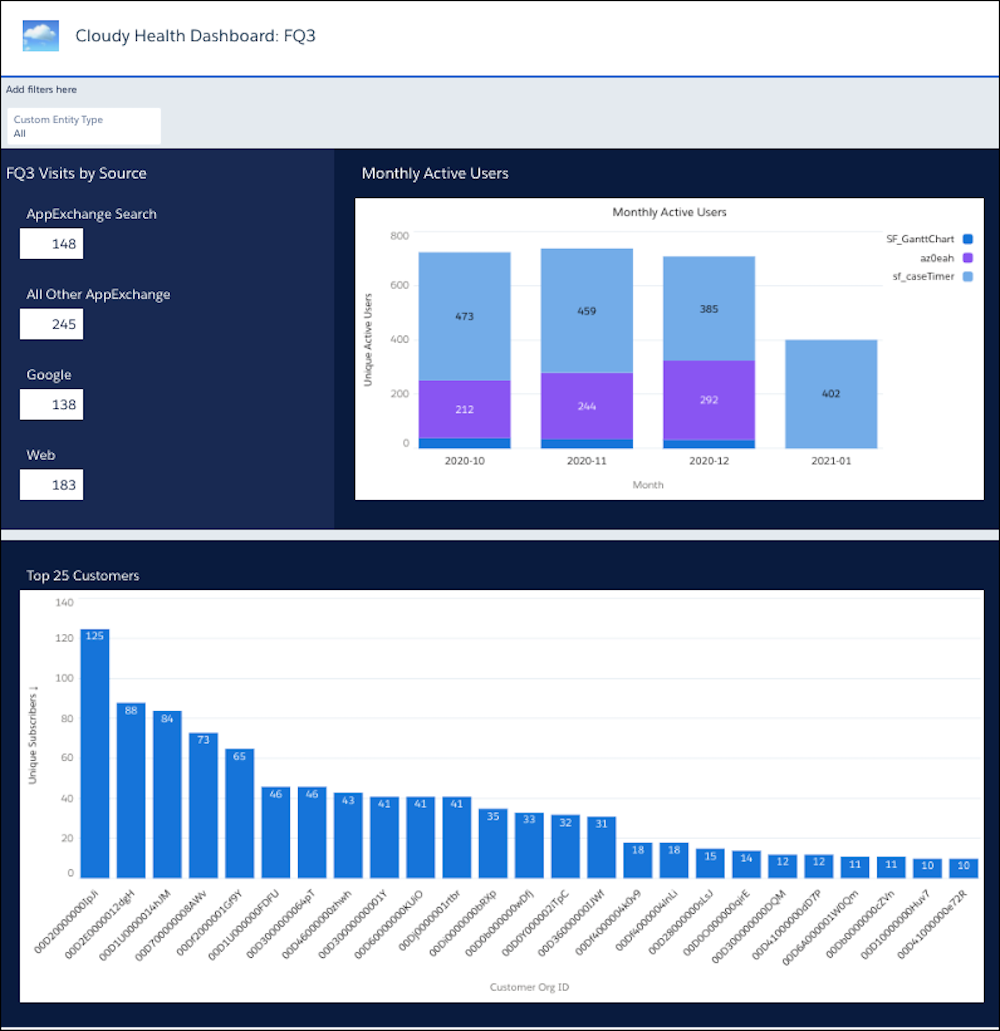
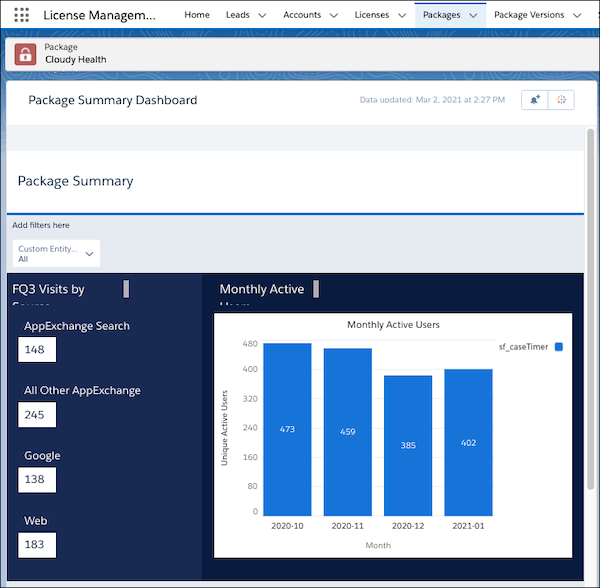
Robert creates a lens for the Top 25 Customers KPI. He also imports the Marketplace Analytics data he downloaded in the first unit, and creates lenses to display listing visits KPIs for the third fiscal quarter. He plays around with CRM Analytics and creates two visualizations and four metrics.
When Robert is finished, he shows Leung his Cloudy Health Dashboard. Wow! It has all the measures she wants to track in a convenient, easy-to-digest visual format.
Add a Dashboard to a Package Record Page
- Click and select App Launcher.
- Click again and select License Management App.
Note: You may be redirected to the Sales app. If so, select and try again.
- Click Packages.
- Open the All packages list view.
- Select a package from the list.
- Click
 and then click Edit Page.
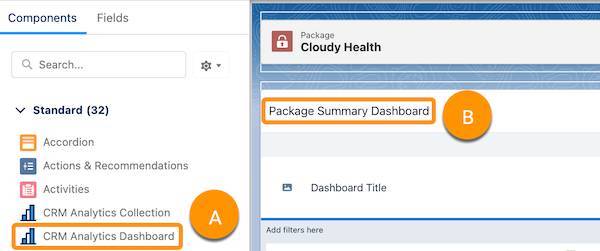
- Drag the CRM Analytics Dashboard component (A) onto the page (B).
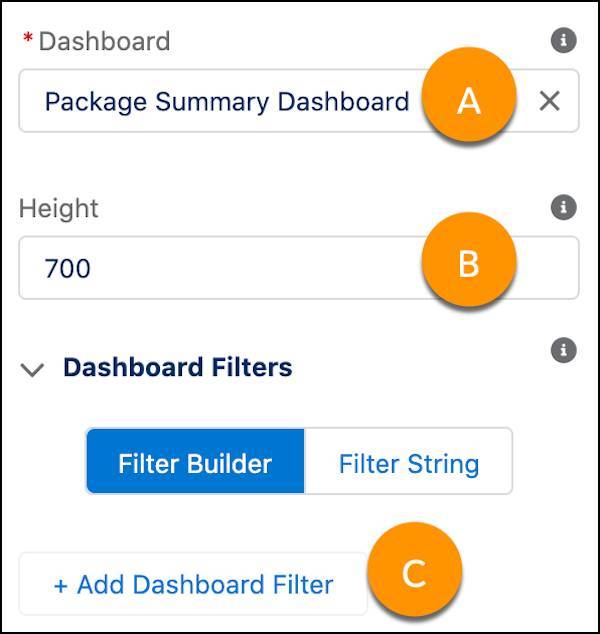
- Select your Package Summary Dashboard (A).
- Change Height to
700(B). - Click Add Dashboard Filter (C).
- For Dataset Field, select Package.sfLma__Package_ID__c.
- Select Locked and Hidden.
- Click Select and in the Select Field picker that opens, choose Package ID.
- Click Done.
- Back on the Dataset window, click OK.
- On the Package Record Page, click Save.
- On the Page Saved window, click Activate.
- On the confirmation window, click Assign as Org Default.

- Select Desktop and phone.
- Click Next and then click Save.
- Save the Package Record page.
- Click
 to exit Lightning App Builder and view the dashboard on your record page.
Wrap It Up
Leung is thrilled. Not only can she view the entire dashboard with all the metrics, but she can also view a package’s detail record page and metrics filtered to that package. She thanks Robert…before she asks him her next set of analytics questions.

That’s the great thing about working with Marketplace Analytics, AppExchange App Analytics, and CRM Analytics: Whatever your next business opportunities are, you can measure them with Salesforce tools. And we’re always improving our toolset, too, so be sure to check the documentation and the Partner Community regularly.
Resources
- Developer Documentation: Analytics External Data API Developer Guide
- Help Doc: Design Complex Datasets with Dataflow Editor
- Help Doc: Upload a CSV File to Create a Dataset
- Trailhead: Create a Product Pipeline Dashboard with CRM Analytics Charts
- Trailhead: Explore with CRM Analytics
- Trailhead: CRM Analytics Basics