Get Started with Partner Intelligence
Learning Objectives
After completing this unit, you’ll be able to:
- Define partner intelligence.
- Explain how partner intelligence can help your business.
- Describe AppExchange partner intelligence products.
- Work with Marketplace Analytics data and visualizations.
Before You Begin
This module assumes that you’re experienced with AppExchange and have a strong understanding of AppExchange solutions and managed packages. To get the most out of this badge, you need prior experience with Salesforce developer tools, including Salesforce command line interface (CLI), Apex, and CRM Analytics.

If you haven’t worked with these tools, or need a refresher, complete these activities before you begin this module.
- Work through the Quick Start: Salesforce DX Trailhead project.
- Take the Build and Administer CRM Analytics Trailhead trail.
- Complete the App Development with Salesforce DX Trailhead module.
These can help you learn the basics of AppExchange app and package development, enable Dev Hub in your Trailhead Playground, install the CLI, and get to know CRM Analytics—all of which will be useful as you’re presented with concepts this badge covers.
Meet Our AppExchange Partner: Get Cloudy
The Get Cloudy Consulting team is hard at work on version 3.0 of their Cloudy Health AppExchange solution. Marketing Manager Leung Chan is working on the business plan, and she needs data she can rely on. She reads on the Salesforce Partner Community that Salesforce offers partner intelligence.

She’s curious, so Leung meets with Get Cloudy’s technical architect, Robert Bullard. Can Robert produce a partner intelligence dashboard? Robert loves learning, so he’s game to learn how to retrieve data and build dashboards with Salesforce.
To see what Robert builds—and how he builds it—work alongside Robert in your own License Management Org (LMO).
Define Partner Intelligence
You’ve probably heard of business intelligence (BI). BI uses software and services to transform data into actionable insights that can inform your company’s business decisions.
Partner intelligence delivers BI insights but goes one step further: Partner intelligence focuses on your specific data needs as an AppExchange partner. Salesforce partner intelligence tools give you:
- Data on your AppExchange listing performance.
- Visibility into your prospects’ and customers’ behavior.
- Insight into the consumption of your managed packages and their contents.
To access this information, you need two partner intelligence tools: Marketplace Analytics and AppExchange App Analytics. Also, you can use any reporting tool to create visualizations, but we recommend our analytics powerhouse, CRM Analytics.
To use our partner intelligence tools, you must enroll in the Salesforce Partner Program and have a security-reviewed solution listed on AppExchange. If you’re a new Salesforce partner, complete the AppExchange Partner Basics module on Trailhead.
Partner Intelligence Tool |
Business Benefit |
Access Method |
Prerequisites |
|---|---|---|---|
Marketplace Analytics |
See how prospects and leads interact with your AppExchange listing. |
|
Marketplace Analytics is available to all AppExchange partners who have solutions available on AppExchange and who have the Manage Listings permission on the Partner Community. |
App Analytics |
Learn how your customers use your AppExchange managed packages and their contents. |
To enable AppExchange App Analytics on your managed package, log a support case in the Salesforce Partner Community. There are a few subtleties and more steps—they’re covered later in this module. |
AppExchange App Analytics is available for packages that have passed security review and are registered to a License Management App (LMA). |
CRM Analytics |
Combine your company’s in-house data with your solution’s App Analytics data in your Salesforce org. |
Enable CRM Analytics in your Salesforce org. |
Two free CRM Analytics licenses are provided within your Partner Business Org (PBO). |
To explore partner intelligence, Leung defines her business questions. She decides to focus on listing performance, customer success, and feature adoption, and jots down her questions. Robert maps Leung’s questions to partner intelligence features, key performance indicators (KPIs), and visualizations.
Category |
Business Question |
Partner Intelligence Tool |
KPIs |
Visualizations |
|---|---|---|---|---|
Listing Performance |
What percent of customers find my listing by searching AppExchange? |
Marketplace Analytics |
AppExchange listing visits by activity source |
Activity Source Timeline |
Customer Success |
Is there high engagement or high attrition? |
App Analytics |
Monthly active users |
Bar chart of active users by month |
Feature Adoption |
Who are my top 25 subscribers? |
App Analytics |
Sum of unique users by customer ID |
Bar chart of top 25 subscribers |
Obtaining partner intelligence data and answering these types of questions—and many more questions that are specific to your solution—can shape your AppExchange strategy and drive more visits and installs.
But first things first: You need data.
Robert wants to learn about Cloudy Health’s AppExchange listing performance. He starts with Marketplace Analytics.
Explore Marketplace Analytics
To access Marketplace Analytics, log in to the Salesforce Partner Community and click the Publishing tab.
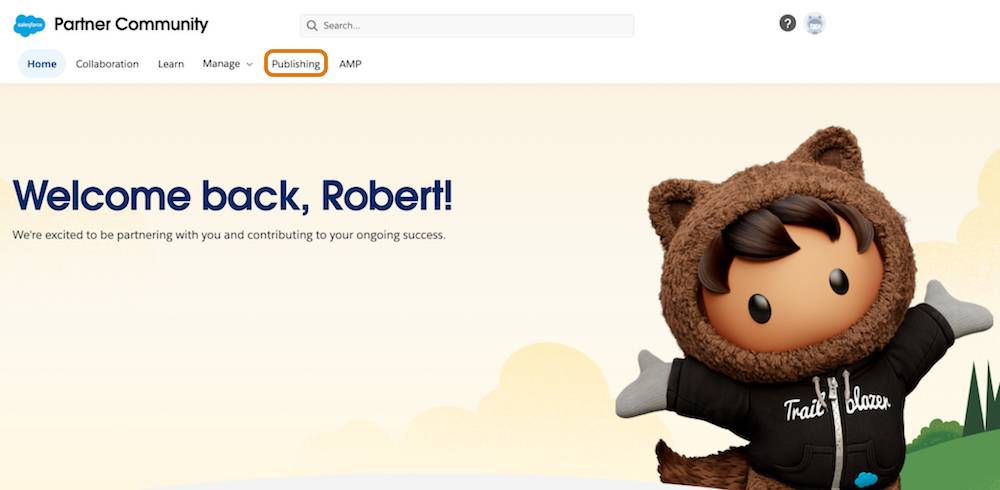
The Partner Console homepage loads.

In the Your Analytics section, click View Analytics.
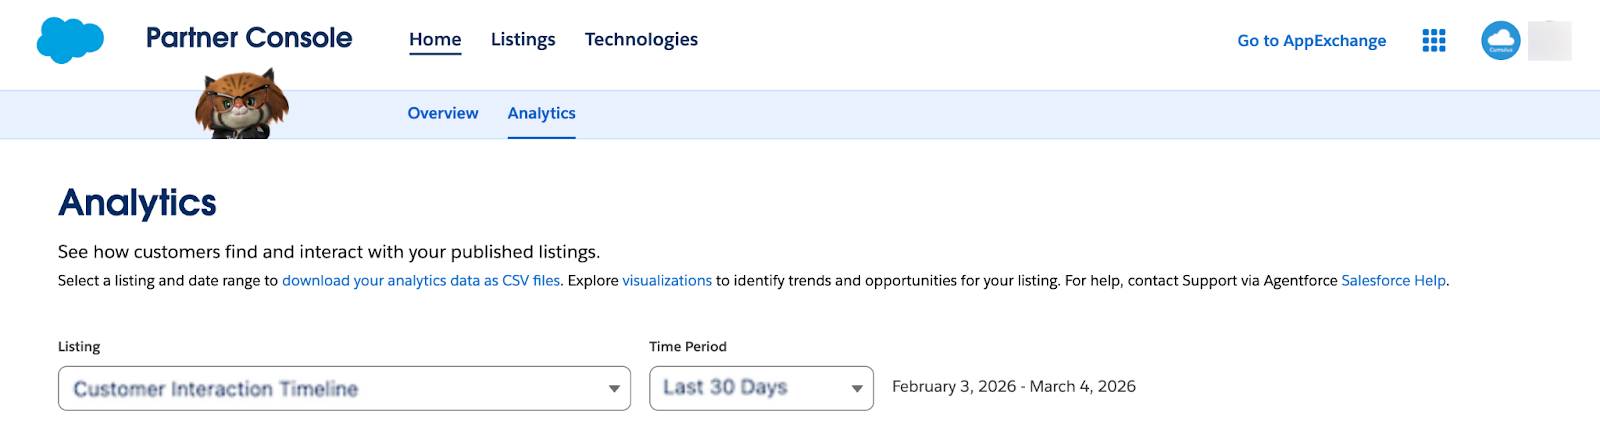
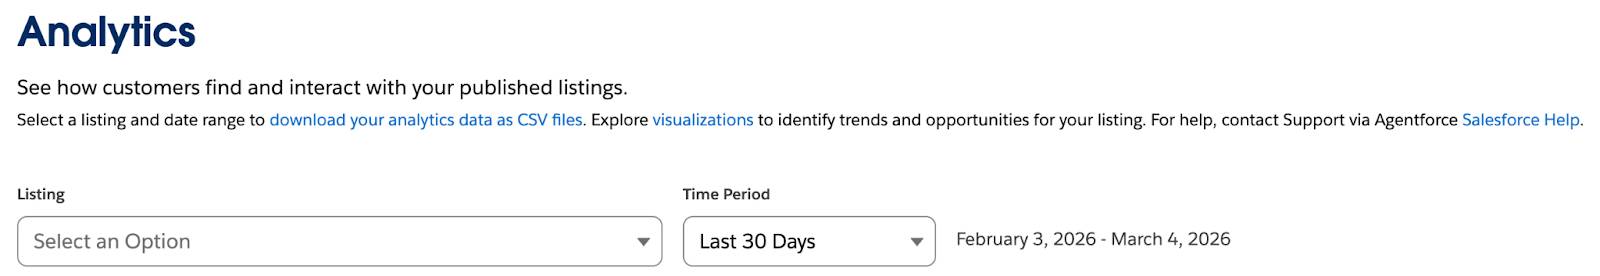
The AppExchange Marketplace Analytics page uses data, trends, and charts to show how Salesforce customers find and use app or consulting service listings. For Partner Co-Marketing Program participants, Marketplace Analytics provides insights about promotion performance.
Apply filters in AppExchange Marketplace Analytics to focus on relevant data. Global filters apply to data in the activity summary and all visualizations. Local filters, where available, apply only to data within an individual visualization.
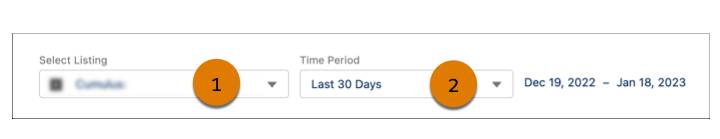
- Select your listing in the Select Listing filter (1).
- Choose Last 30 Days from the Time Period picklist (2).

To learn more about a metric’s definition, hover over its info bubble.
Activity Source Timeline
Robert sees the Activity Source Timeline.
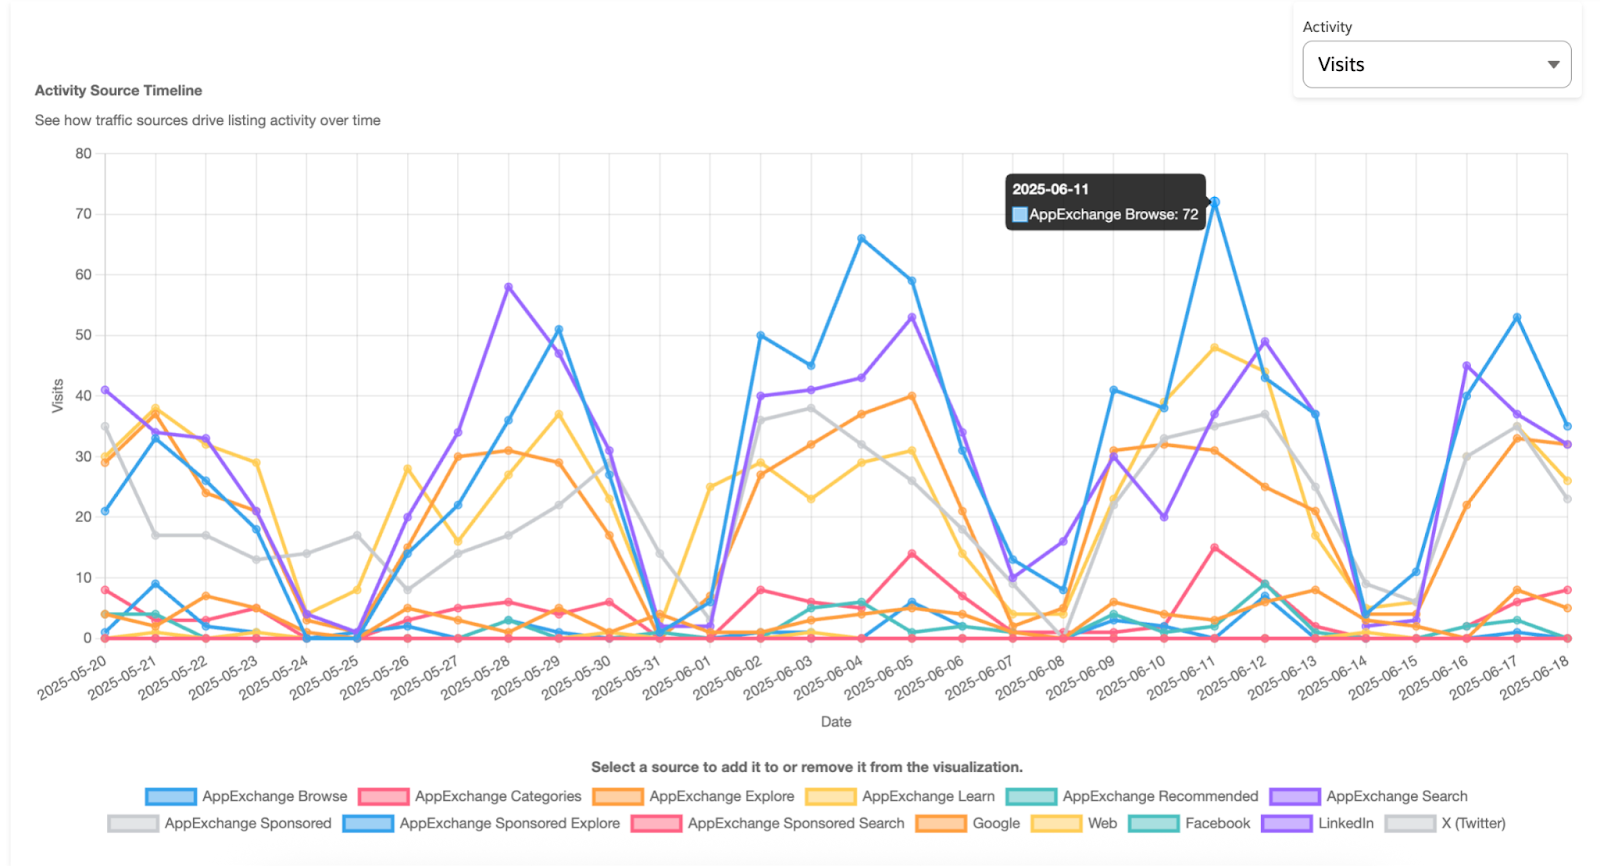
It contains tons of data—here's what’s what.
Data Element |
Description |
Business Use Case Questions |
|---|---|---|
Tile Views |
Views of your listing tile |
How many customers view your listing tile per day and per month? |
Tile Hovers |
Hovers over your listing tile |
What percentage of customers take a first interaction step with your listing by hovering over your listing tile? |
Visits |
Unique listing visitors |
What volume of customers arrive at your listing from which sources? |
Lead Events |
Lead events on your listing, which include demos, test drives, and Get It Now clicks, or installs |
What percentage of customers who view your listing tile click it to arrive at your listing? |
Installs |
Installs of your solution initiated on AppExchange, your website, or from a code repository |
Who installs your solution and from which traffic sources? What percentage of customers click Get It Now and install your solution? |
Use the Activity Source Timeline picklists to explore sources, focus on activities, and change views by period.
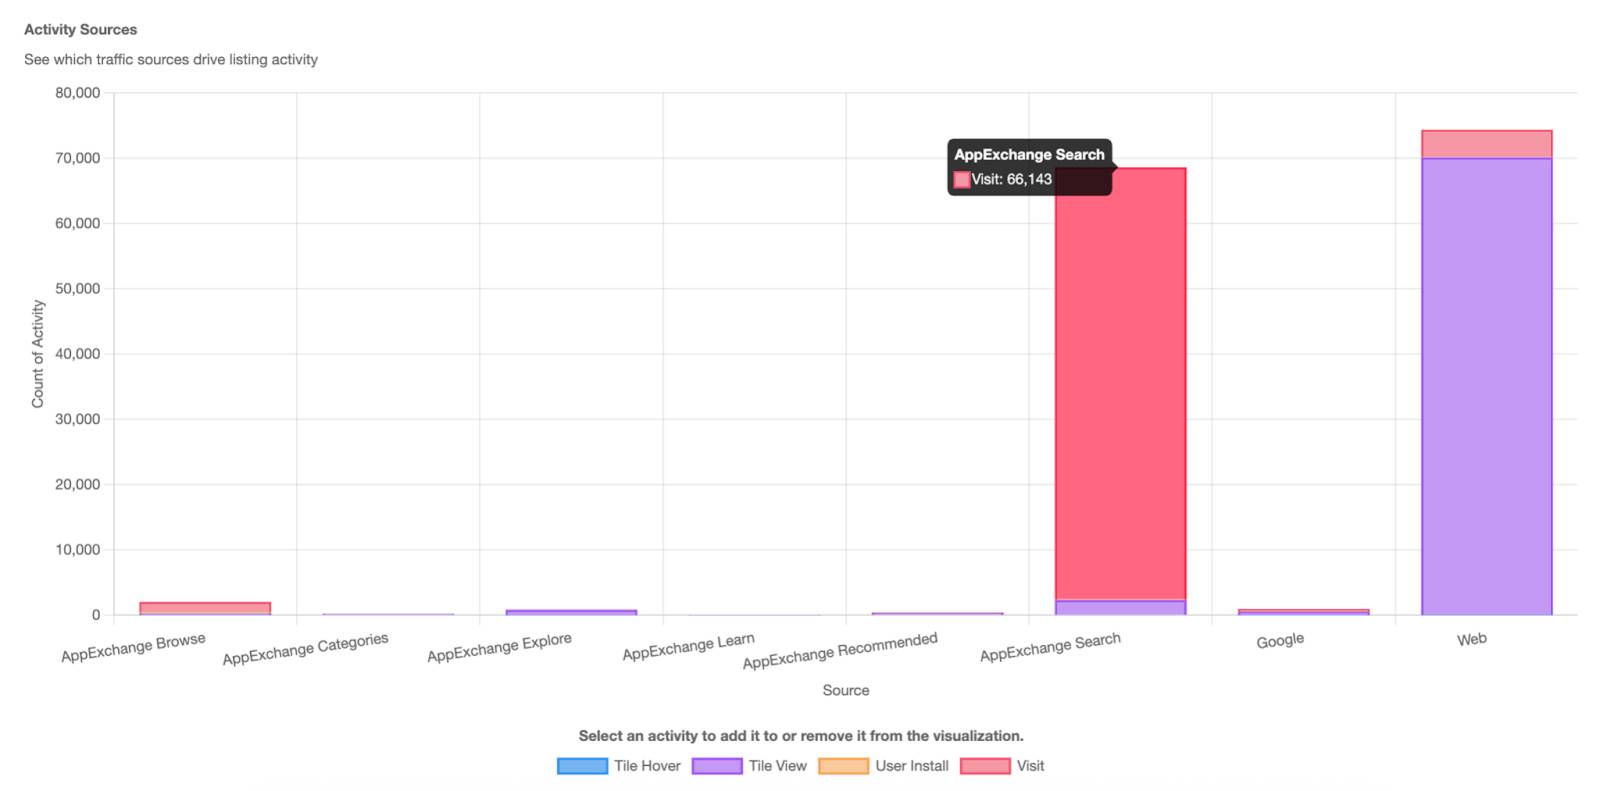
Activity Sources
To see which traffic sources drive listing activity, check out Activity Sources.
Top AppExchange Searches
To see which terms drive listing activity, check out Top AppExchange Searches. The default view shows visits and installs.
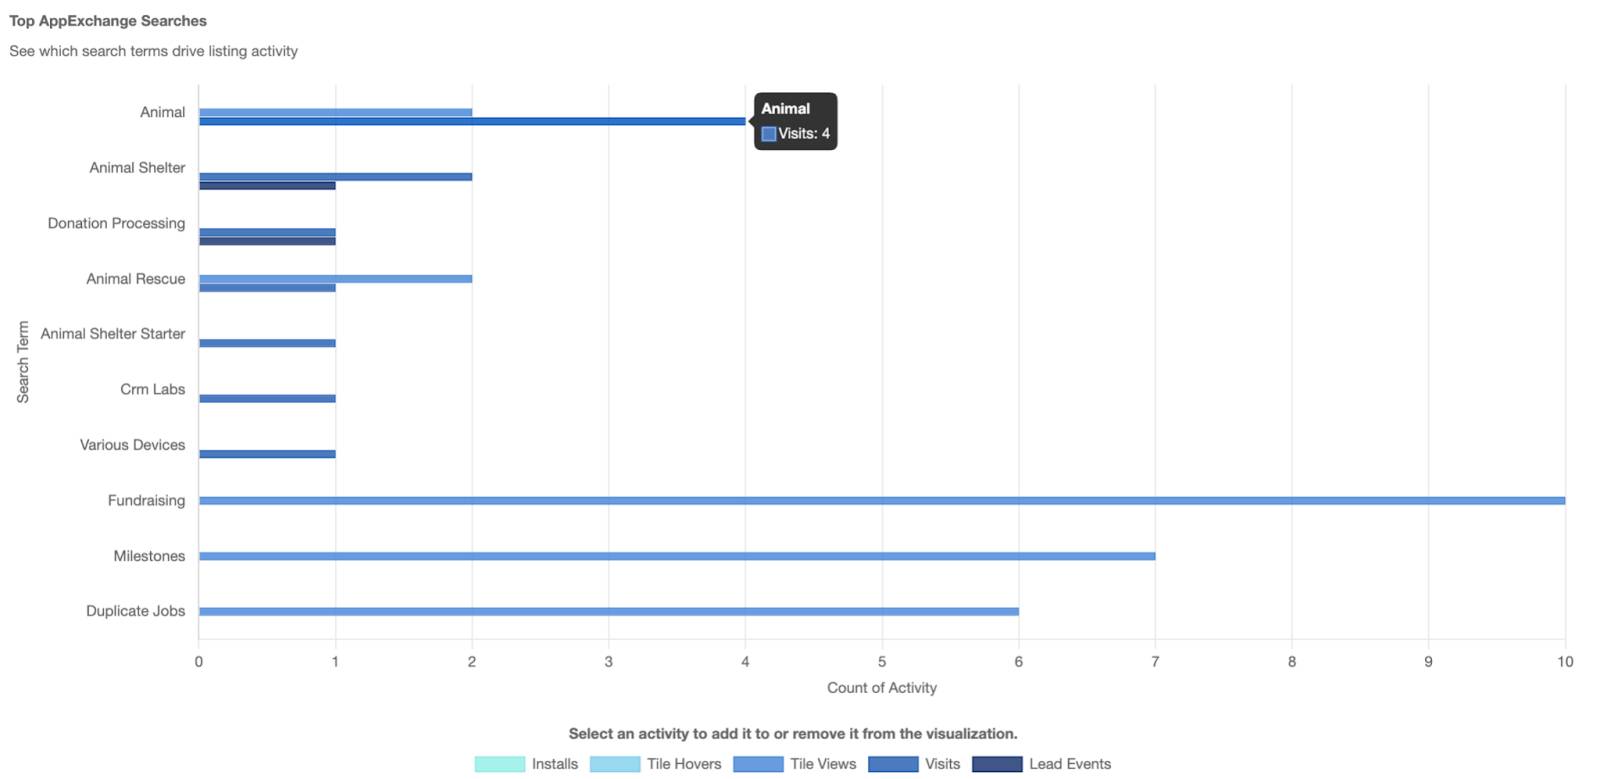
Robert uses the Activity picklist to select All. He scrolls down to view all search terms.
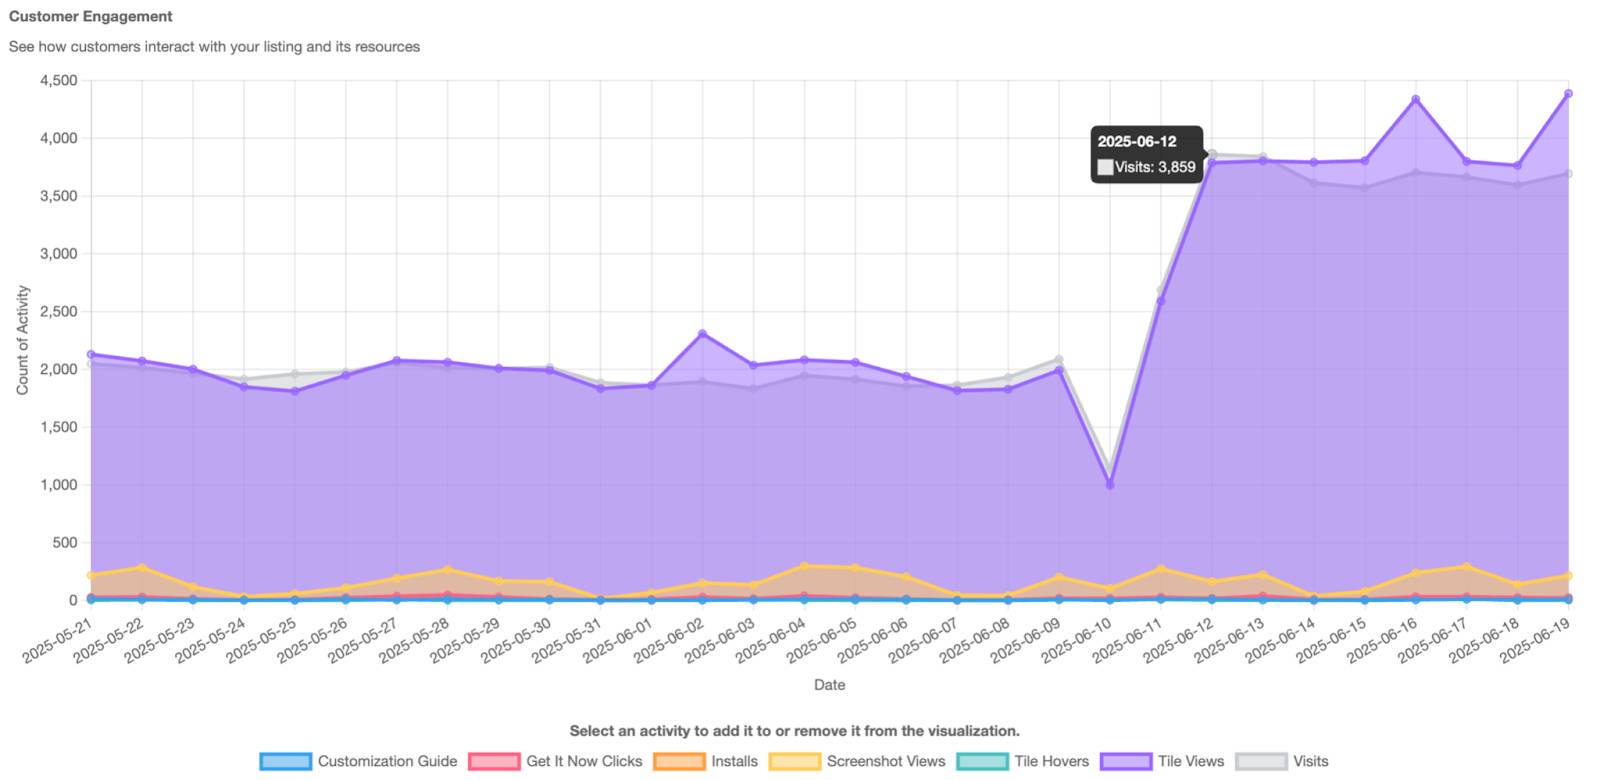
Customer Engagement
Scroll to the Customer Engagement chart to analyze customer activities by time period. The default view is by Resource Views. Resources include AppExchange listing features, such as webinars and case studies.
Robert selects an activity from the Activity picklist.
Export Marketplace Analytics Data
Next, Robert downloads the data in comma-separated value (CSV) format to integrate later with AppExchange App Analytics and License Management App (LMA) data using CRM Analytics. You walk through the integration steps in the next couple of units.
Robert checks his filters, and makes a few changes. Then he exports the data. The data he downloads matches the filters that he selected on the visualizations.
In this unit, you learned what partner intelligence is, and what partner intelligence products Salesforce offers. You also learned about Marketplace Analytics and reviewed its visualizations. In the next unit, you learn about AppExchange App Analytics.
Resources
- ISVforce Guide: Monitor Performance with Analytics for AppExchange Partners
- Medium Blog Post: Salesforce Overview for ISVs
- Salesforce Partner Community: Salesforce Partner Program Overview (log in required)
- Trailhead: AppExchange Partner Basics