Inspect Objects at Checkpoints
Learning Objectives
After completing this unit, you’ll be able to:
- Set up checkpoints in your Apex code.
- Analyze the objects in memory using the Checkpoint Inspector.
Set Checkpoints in Your Apex Code
The moment your spaceship starts sounding system errors, you have to head straight to the logs to figure out what went wrong and where.
Similarly, when your Apex code is causing errors, has performance issues, or isn’t producing the desired results, your first step is to identify the problem using your debug log. Combing line by line through the entire log is a tedious task. That’s where checkpoints come in handy! Checkpoints show you snapshots of what’s happening in your Apex code at particular points during execution.
You can set up to five checkpoints in your Apex code. Checkpoints aren’t available for Visualforce markup.
Let’s set a checkpoint in the EmailMissionSpecialistclass that we created earlier.
- Select File | Open, and open the
EmailMissionSpecialistclass.
- Select Debug | Change Log Levels.
- In the General Trace Settings for You section, click Add/Change.
- Set the
ApexCodelog level to FINEST.
Note: To set checkpoints, you need the View All Data user permission. To generate results using checkpoints, run code using execute anonymous, or set a DEVELOPER_LOG trace flag on yourself. The trace flag must have a log level for Apex of INFO or higher.
- To save your changes, click Done.
- To exit the Change Log Levels dialog box, click Done.
When your code is displayed in the source code editor, you can see line numbers on the left side. Click the line number for inspectResults(results);. A red dot (1) appears, indicating that a checkpoint has been created.

Now you can execute your code and analyze it using the Checkpoints tab.
Checkpoints Tab
You can view exactly where your code’s execution is going wrong, and what the values of the objects are at that point, using the Checkpoints tab. Let’s run this code to see the checkpoint in action.
Select Debug | Open Execute Anonymous Window. Enter the following code and execute it. Be sure to replace Enter your email address with your email address.
EmailMissionSpecialist em = new EmailMissionSpecialist();
em.sendMail('Enter your email address', 'Flight Path Change',
   'Mission Control 123: Your flight path has been changed to avoid collision '
   + 'with asteroid 2014 QO441.');
After you run the Apex code successfully, open your debug log and click the Checkpoints tab to see the results.

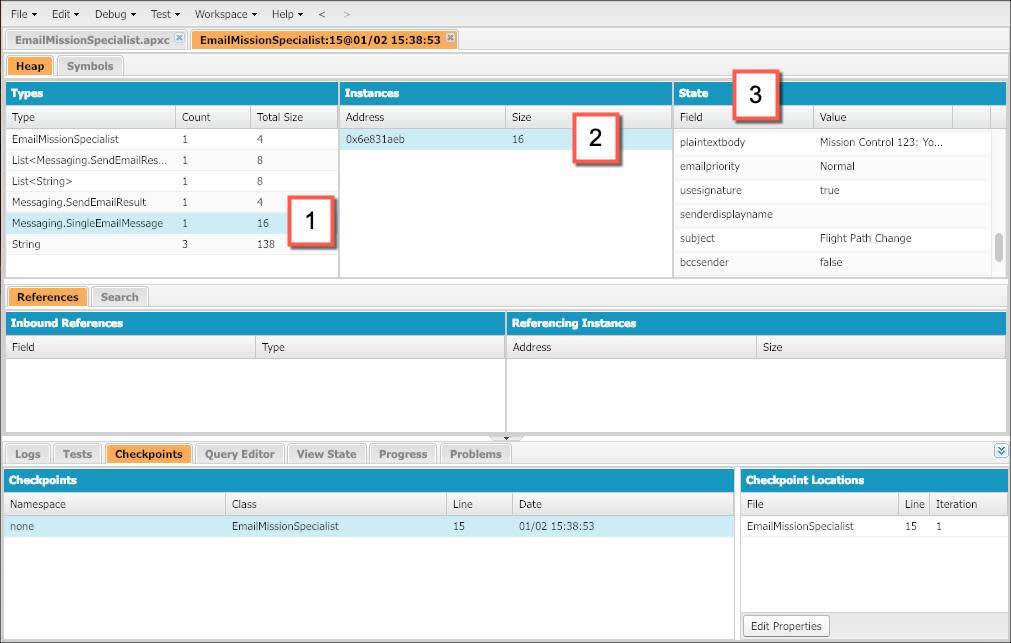
- The Checkpoints table displays the namespace, class, and line number of each checkpoint. It also shows you the date and time when each checkpoint was created.
- The Checkpoint Locations table displays the file name, line number, and iterations captured by the selected checkpoint.
Double-click a checkpoint in the Checkpoints table to see the captured results in the Checkpoint Inspector. Now the fun begins!
Checkpoint Inspector
The Checkpoint Inspector has two tabs: Heap and Symbols.
-
Heap—Displays all objects present in memory at the line of code where your checkpoint was executed.
-
Symbols—Displays all symbols in memory in tree view.
Heap Tab
The Heap tab includes some great panels for debugging, like the Types panel. This panel shows how many objects were instantiated and the memory they consumed in bytes. Let’s look at the details captured by the checkpoint you set.
- Under Types, click
Messaging.SingleEmailMessage.
- Under Instances, click any instance of this object type.
- Under State, view the object’s fields and their values.

Symbols Tab
The Symbols tab is a quick and simple way to review the states of various objects at any checkpoint. Symbols are unique names that reference particular objects. The tab displays all symbols in memory using a tree view.

As the Commander, you don’t just need to check whether the systems are running smoothly—you also need to track down errors. Let’s see how the Checkpoint Inspector can help you understand your code better.
- To clear the checkpoint results from the tab, select Debug | Clear | Checkpoint Results Panel.
- Select Debug | Open Execute Anonymous Window.
- Run the
EmailMissionSpecialistclass again, this time with an invalid email address, such as testingemail.EmailMissionSpecialist em = new EmailMissionSpecialist(); em.sendMail('testingemail', 'Flight Path Change', 'Mission Control 123: Your flight path has been changed to avoid collision ' + 'with asteroid 2014 QO441.'); - After you run the code, click the Checkpoints tab.
The Checkpoints tab doesn’t show any results, because the execution of your code didn’t reach the line number where your checkpoint was set.

Let’s add a checkpoint earlier in the code, so that we can capture information at the new checkpoint before our code hits the testingemailerror.
- Select File | Open and open the
EmailMissionSpecialistclass.
- Click the line number on the left for
String[] toAddresses = new String[] {address}.
- Select Debug | Clear | Checkpoint Results Panel.
- Select Debug | Open Execute Anonymous Window.
- Run the
EmailMissionSpecialistclass again with an invalid email address, such as testingemail.EmailMissionSpecialist em = new EmailMissionSpecialist(); em.sendMail('testingemail', 'Flight Path Change', 'Mission Control 123: Your flight path has been changed to avoid collision ' + 'with asteroid 2014 QO441.'); - Click the Checkpoints tab.
You see a new entry in the Checkpoints tab. You can now analyze the objects in memory by using the Checkpoint Inspector.

Resources
- Salesforce Help: Checkpoints Tab
- Salesforce Help: Set Checkpoints in Apex Code
- Salesforce Help: Checkpoint Inspector