Amplify Recruitment Yield with Effective Reporting
Learning Objectives
After completing this unit, you'll be able to:
- Explain how reports help you answer questions with data.
- Describe how dashboards allow your team to visualize their data.
The recruitment and admissions team at Cloudy College is constantly collecting information about new and prospective students. Salesforce has proven to be a game-changer in the way Cloudy captures and organizes all of this student data. However, the Cloudy College team realized that until they started using reports and dashboards to make their data actionable, they were just scratching the surface of the impact Salesforce for Education could have on their work. Read on to see how the team puts these tools to use in order to focus on key metrics and make informed decisions about their recruitment and admissions strategies.
Reporting Basics
Salesforce reports make it possible for you to ask your data questions. If you hone in on a specific and functional question, reports will provide you with a concise and relevant answer. Doing a little pre-work before you start building a report will pay in dividends:
- Be thoughtful and precise with your question.
- Check to make sure there are no existing reports that already answer your query.
Once your planning is complete, it’s time to select a report type that will help you get answers from your data.
Choosing a Standard Versus Custom Report Type
Salesforce reports are easily customizable, and standard report types fill most needs. The team at Cloudy College finds that having a bank of ready-made reports is really helpful. When recruiters want to create a list of prospective students to connect with during a tri-county high school college fair, the Contacts & Accounts report type makes it easy. When the admissions team needs to create a list of parents for the parent meeting held before freshmen orientation, the Contacts with Relationships report type does the trick. But some of Cloudy’s more specific reporting needs can’t be covered by a standard report. The Cloudy team isn’t worried though, because they know that’s exactly what custom report types are for.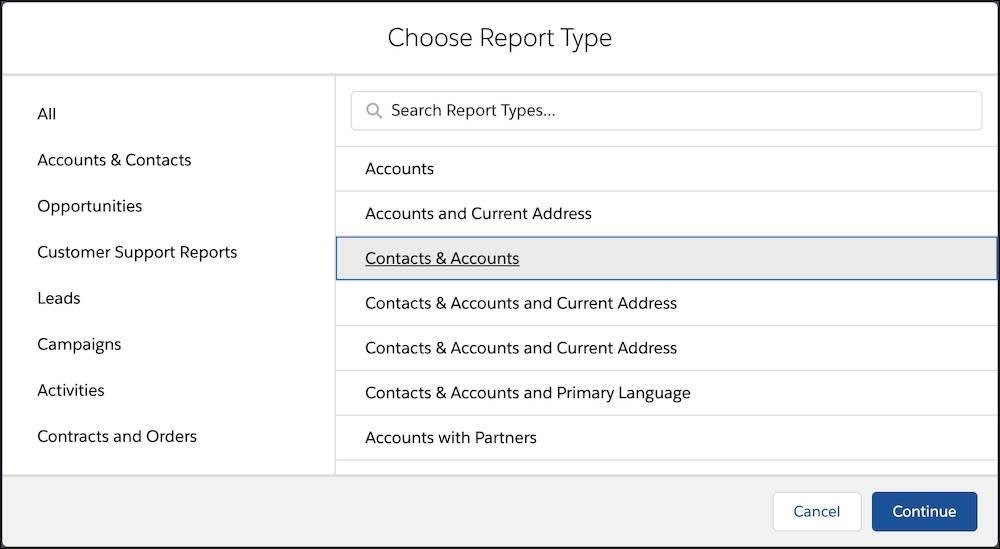
Custom report types can be created to link two or more objects together that are not connected in any standard report. For example, recruiters at Cloudy College want to see how many students are in any given stage of their application process (for example, Prospecting, Application Started, Application Completed, In Review, Admission Offered, and Admission Accepted). To answer this question, the Director of Admissions asks Cloudy’s Salesforce administrator to help build a custom report named New Student Application Stages.
Follow these steps to create a report like the New Student Application Stages report (Optional).
- From the reports tab, click New Report.
- Choose a report type, then click Continue.
- The report opens in edit mode, and shows a preview.
a. In edit mode, add and remove fields to your report as columns, group rows and columns, filter report data, and show or hide a chart.
b. Customize your report until it shows exactly the data that you need. - To add a column to your report,
a. Choose a field from the Add column... picklist.
b. Alternatively, expand the Fields pane, then drag-and-drop a field onto the Columns list or directly onto the report preview. - To remove a column from your report,
a. From the Columns list, find the column you want to remove. Then click the "X" icon ( ).
).
b. Alternatively, from the preview pane, find the column you want to remove. Click the dropdown icon ( ) | Remove Column.
c. To remove all columns from your report, from the Columns list, click the delete icon ( ).
). - To group records in your report,
a. Choose a column from the Add group... picklist under GROUP ROWS.
After grouping a row, you can group a column by choosing a column from the Add group... picklist under GROUP COLUMNS.
Group up to 2 rows and 2 columns. - After adding a group, you can show or hide detail rows, subtotals, and a grand total by toggling switches at the bottom of the preview pane.
- To filter records from your report, click
 FILTERS. To add a field filter, choose a field from the Add filter... picklist.
a. To edit a filter, including standard filters, click the filter.
b. To remove a filter, click the "X" icon ( ) on the filter.
 - Click Save. If you’re creating a brand new report, give it a name. Optionally, give it a description. With access and sharing in mind, save the report in an appropriate folder.
- To view complete report results, click Run.
Dashboard Basics
Dashboards are visual representations of reports. They’re a great tool when you need to share information found in multiple reports or present data to other members of your team or leadership. Salesforce empowers you to customize your dashboards so you can focus on metrics that matter.
Dashboards are also a handy way to do a quick temperature check of important metrics. For that at-a-glance experience, embed relevant dashboards on your home page so they’re the first thing you see when you log in.
Let’s look at an example of the “why” and the “how to” of creating a dashboard.
- Why: The Director of Admissions at Cloudy College is meeting with leadership to discuss the upcoming recruiting class. She knows the data in the New Student Application Stages report is impactful, and she knows having a visual of the data will make her presentation stronger than simply rattling off metrics.
- How to: She creates a dashboard for the report and embeds it in her slide deck.
Follow these steps to create a dashboard like the one the Director of Admissions created for the New Student Application Stages report (Optional).
- From the Dashboards tab, click New Dashboard.
- Name the dashboard.
- Then, place the dashboard in a folder. Private Dashboards is the default folder.
- To add a component to the dashboard, click + Component.
a. Choose a source report for the component, then click Select.
b. Customize how the component displays data, then click Add.
c. Arrange and resize the component as necessary.
d. To edit an existing component, click the pencil icon ( ). To remove a component, click the X icon (
  ).
). - To add a filter to the dashboard, click + Filter.
a. From the Field dropdown, select a field to filter on. The dropdown shows fields that can be used to filter all the dashboard’s components. If there are equivalent fields for your selection, hover over the info icon ( ) to see them.
b. Give the filter a Display Name to identify it. If the filter has many equivalent fields, we consider using a name that works for all components.
c. Assign values to the filter by clicking Add Filter Value. - Click Save.
Now that you know how easy it is to create a new dashboard, just think about all the possibilities there are for building dashboards for individual and team use. To create a dashboard that monitors a variety of metrics, just repeat Step (5) above and add multiple reports to one dashboard. Voila! Get at-a-glance access to a number of reports that show your progress and its impact on team goals.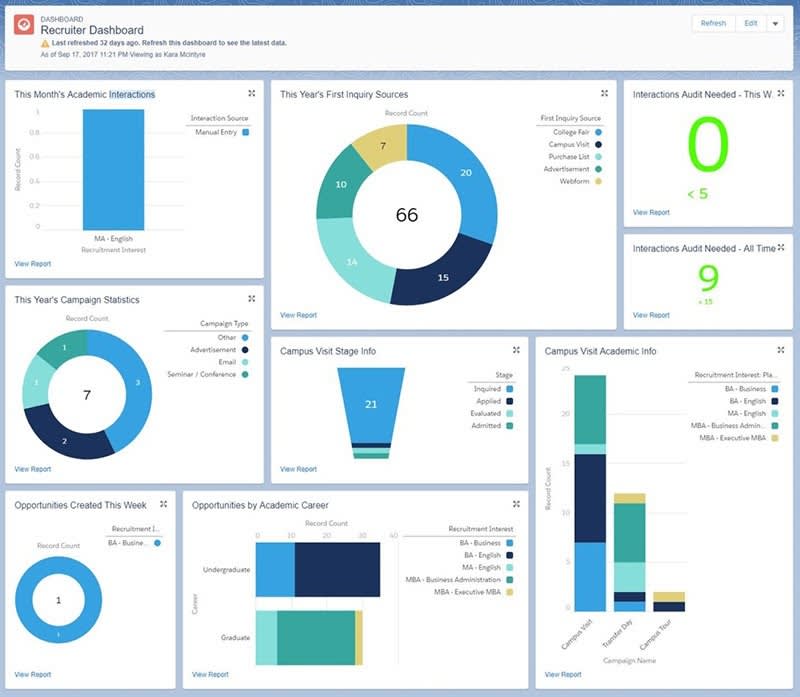
When you use reports and dashboards to facilitate discussions about the data you’re collecting in Salesforce, you unlock the power to make data-driven decisions to support prospective and new students, as well as your recruitment and admissions staff. Reports and dashboards help you understand your data and the story it tells you. When you understand your data, you can act on it to drive transformation at your institution.