Create the Dataset
What You’ll Learn
This project introduces you to creating custom maps and tuning those maps to enhance your visualization. In it, you’ll learn:
- How to reformat GeoJSON so that it can be used in CRM Analytics.
- How to upload GeoJSON to CRM Analytics to create a custom map.
- How to use a bounding box to zoom in on an area in the map.
What’s a Custom Map?
CRM Analytics has built-in map charts of various geographical areas. You can use them like any other chart to display a visualization of your data. But what if you can’t find the map you need for the data you have? That’s where custom maps enter the scene!
Custom maps are based on a standard GeoJSON definition file that contains metadata and coordinates for drawing the map. CRM Analytics can read the GeoJSON file and display the encoded map as just another map chart.
First, set up your CRM Analytics-Enabled Developer Edition org.
Sign Up for an CRM Analytics-Enabled Developer Edition Org
For this project, you can’t use an existing Developer Edition org or a Trailhead Playground org. Follow the steps below to get a CRM Analytics-enabled Developer Edition that comes with a limited CRM Analytics Platform license and contains the sample data required for this project.
- Go to trailhead.salesforce.com/promo/orgs/analytics-de.
- Fill out the form using an active email address.
- After you fill out the form, click Sign me up. An activation email is sent to you.
- When you receive the activation email, open it and click Verify Account.
- Complete your registration, and set your password and challenge question.
- Click Change Password. You’ll be logged in to your new CRM Analytics Developer Edition org. If you see the Welcome to Lightning Experience window, close it.
Tip To log in to the CRM Analytics-enabled developer org when you take the challenge at the end of this page, select Log into a Developer Edition from the connection menu. To log in and play any time, go to login.salesforce.com.
Get the Data
To build our custom map, we start with some interesting data. We’ve got public IRS filing statistics for various zip codes in the Los Angeles area, which you can download from here. This information has been aggregated, so no, you can’t view the tax returns of the rich and famous.
The data is in a CSV file with the following format:
 "Zipcode","ZipCodeType","City","State","LocationType","Lat","Long","Location","Decommisioned",
"TaxReturnsFiled","EstimatedPopulation","TotalWages"
"90001","STANDARD","LOS ANGELES","CA","PRIMARY",33.97,-118.24,"NA-US-CA-LOS ANGELES","false",18561,36200,421709138
"90002","STANDARD","LOS ANGELES","CA","PRIMARY",33.94,-118.24,"NA-US-CA-LOS ANGELES","false",16133,30920,352278879
"90003","STANDARD","LOS ANGELES","CA","PRIMARY",33.96,-118.27,"NA-US-CA-LOS ANGELES","false",21982,41878,463744071
"90004","STANDARD","LOS ANGELES","CA","PRIMARY",34.07,-118.31,"NA-US-CA-LOS ANGELES","false",25057,41632,891085777
"90005","STANDARD","LOS ANGELES","CA","PRIMARY",34.05,-118.31,"NA-US-CA-LOS ANGELES","false",13294,22281,369162475
"90006","STANDARD","LOS ANGELES","CA","PRIMARY",34.04,-118.29,"NA-US-CA-LOS ANGELES","false",19691,34995,398768368
"90007","STANDARD","LOS ANGELES","CA","PRIMARY",34.02,-118.28,"NA-US-CA-LOS ANGELES","false",12367,20179,262370773
"90008","STANDARD","LOS ANGELES","CA","PRIMARY",34.00,-118.34,"NA-US-CA-LOS ANGELES","false",13333,21174,426689767
"90009","PO BOX","LOS ANGELES","CA","PRIMARY",33.94,-118.38,"NA-US-CA-LOS ANGELES","false",1137,1715,49947779
"90010","STANDARD","LOS ANGELES","CA","PRIMARY",34.06,-118.31,"NA-US-CA-LOS ANGELES","false",2055,3294,122651252
Let’s upload the file to create a dataset.
- If you’re not already there, log in to your Developer Edition org.
- In Lightning Experience, click
 , then click the Analytics Studio tile. In Salesforce Classic, select Analytics Studio from the app menu at the upper right.
- In Analytics Studio, click Create in the upper right, and select Dataset from the menu.
- Click CSV File as the source of the data.
- In the New Dataset screen, click Select file or drag file here.
- In the file-selection window that opens, select the CSV file you downloaded—look for the file named la_zip_codes.csv.
- Click Open (or the correct button in your operating system to upload the file), and then click Next.
- Verify that the Dataset Name is la_zip_codes, and click Next.
- In the Edit Field Attributes screen, click the Zipcode column heading, then change its field type to Dimension.

- Click Upload File.
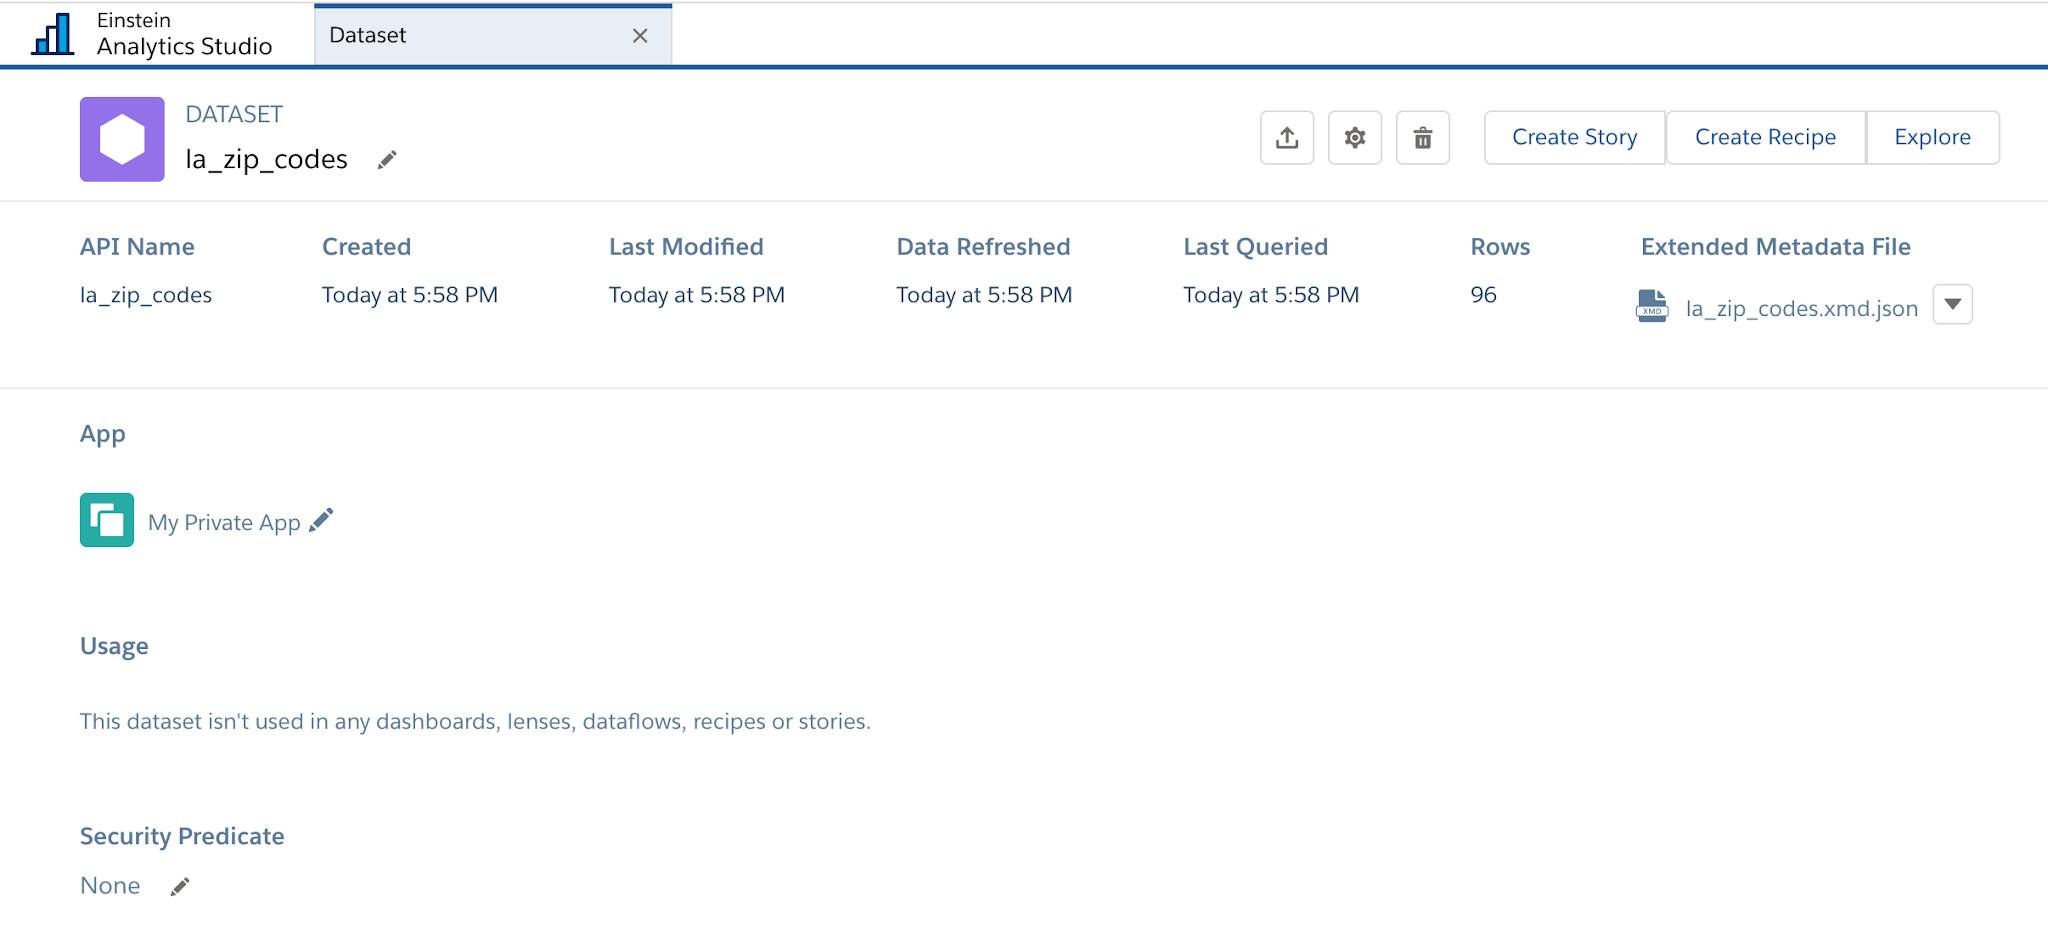
After a minute or so, check the Datasets tab to see your dataset.
Great work! The data is ready for you to explore in CRM Analytics. Next, you’ll get the GeoJSON and create a custom map.