Use Browser Tools to Help You Debug
Viewing and testing your Lightning web components on a simulated mobile device is a huge step forward in developing mobile-friendly components.
But what happens when you need to debug a tricky problem that only appears when your component runs on a mobile device? The great news is that you debug components on mobile the same way you do for desktop, using Safari Web Inspector and Google DevTools. The only difference is how you set it up.
Run Your Simulator and Emulator
Safari Web Inspector and Google DevTools connect to Xcode iOS simulators and Android Studio emulators, respectively. So before you can start debugging your component, you need to start running your component on a virtual device.
If it’s your first time doing that, we recommend using Live Preview. Complete the Trailhead project Set Up Your Lightning Web Components Developer Tools to create a Lightning app and use Live Preview to preview it in a simulator or emulator. When you’re done, return to this step.
Enable Debug Mode
The first step you need to do before using either browser developer tool is to enable debug mode in your Trailhead playground.
- From Setup, enter
Debug Modein the Quick Find box, then select Debug Mode.
- In the user list, click the checkbox next to your user.
- Click Enable.
Connect Safari Developer Tools
Next, connect the Safari Developer tools to your iOS simulator.

- Open Safari on your desktop.
- Select Safari | Settings.
- Select Advanced.
- Enable Show features for web developers. Close the Settings panel.
- Select Develop | device (Simulator) | Trailhead org URL.
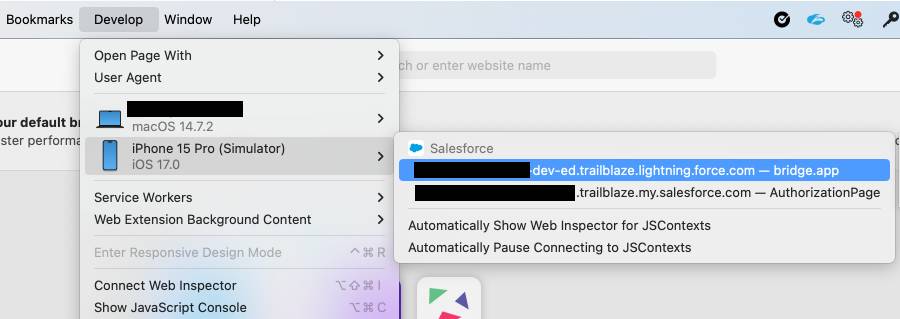
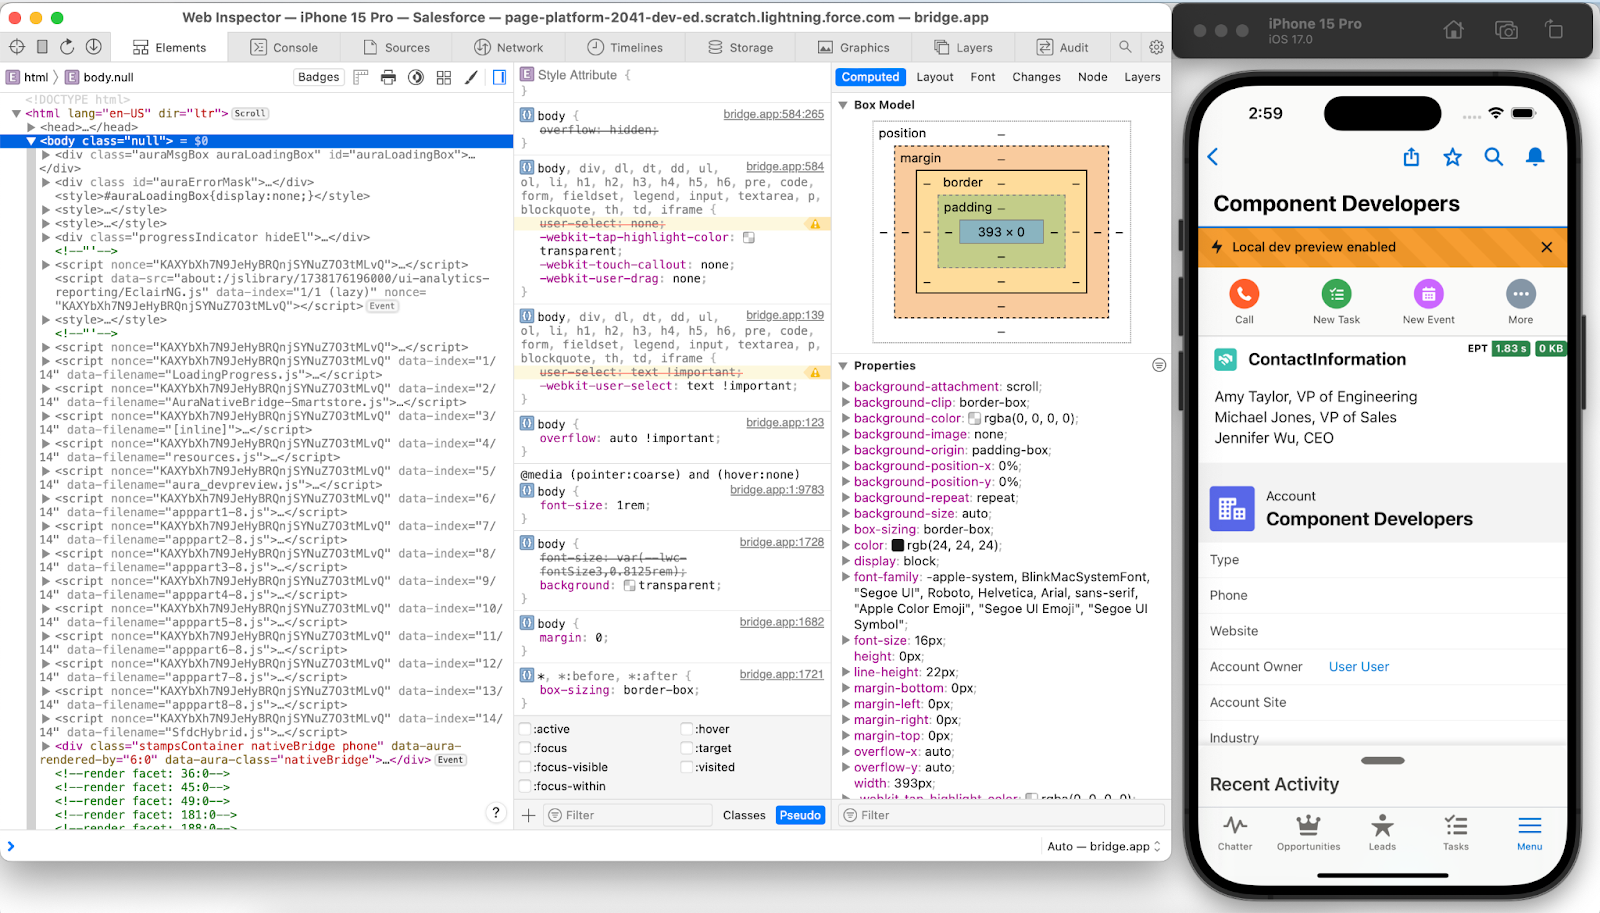
A window appears containing the Safari Developer tools connected to your simulator.
Connect Chrome DevTools
And here’s how you set up Chrome DevTools with your Android emulator.
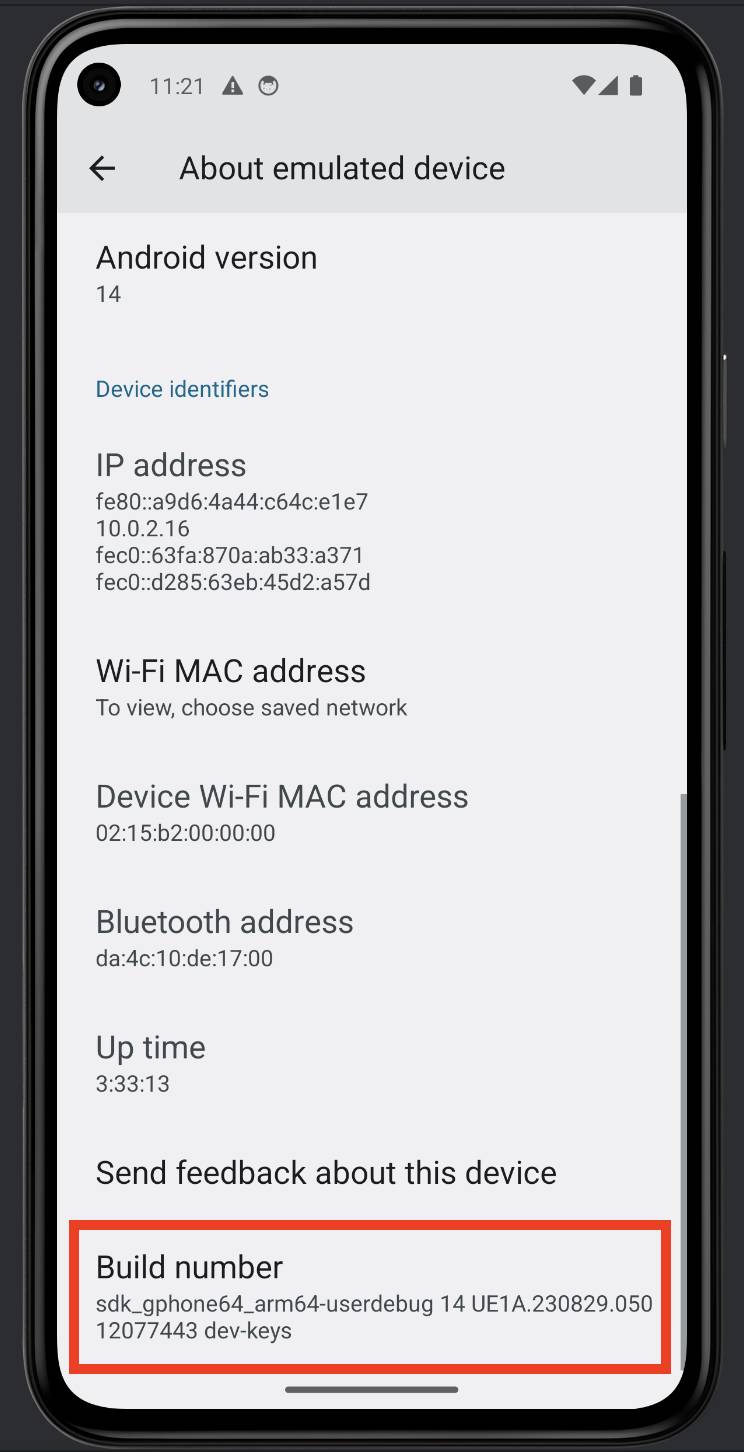
- On your emulated Android device, open the Settings app.
- Enter
About emulated deviceinto the search bar and click it.
- Scroll to the bottom of the page and click Build number 7 times. The message “You are now a developer!” appears when you click it enough, which means that developer mode was successfully enabled for the emulator.
- Return to the home screen, open the Salesforce mobile app, and navigate to your custom Lightning web component.
- Open Chrome on your desktop. In the location bar, enter
chrome://inspect/#devices.
- Click Inspect under the Remote Target emulator you’re working with.
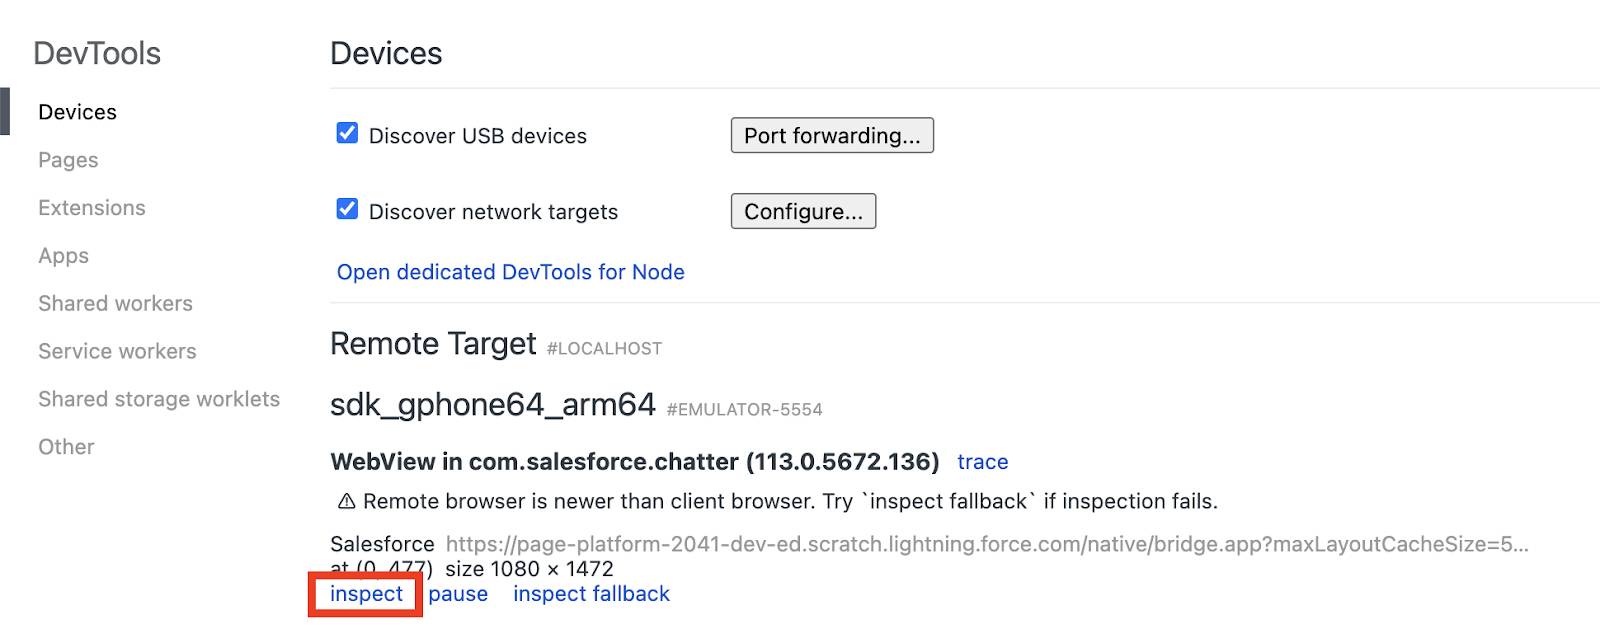
A window appears containing your emulator with the Chrome DevTools connected to it.

With Visual Studio Code, the iOS simulator, the Android emulator, browser developer tools, and Lightning App Builder all working together, it’s super easy to view, interact with, test, and ensure your apps can work with mobile.
We won’t check any of your setup or changes. Click Verify Step to get your badge!
Resources
- Salesforce Developer: Enable Debug Mode in Salesforce
- Salesforce Developer: Debug Your Components with Virtual Device Builds