Create a Dashboard with a Conversational Query
Follow Along with Trail Together
Want to follow along with an expert as you work through this step? Take a look at this video, part of the Trail Together series.
(This clip starts at the 10:30 minute mark, in case you want to rewind and watch the beginning of the step again.)
Introduction
A dashboard is an interactive collection of widgets that visualizes data query results. Now you’re going to create a dashboard with an interactive chart, a list widget, and a table. You’ll incorporate the lens from the previous step and learn about tools in the dashboard designer, including conversational exploration.
Add the Lens to a Dashboard
To include a lens in a dashboard, clip it. When you clip the lens, CRM Analytics adds the query as a step in a new dashboard (or the most recently used open dashboard).
- In your new lens, click
 to clip the query.
- Under Display Label, enter
Amount by Industryand then click Clip to Designer.
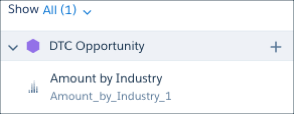
CRM Analytics opens the dashboard designer and adds the query in the query panel. The new query displays under the dataset that’s being queried, DTC Opportunity.
- Drag the Amount by Industry query onto the new dashboard grid.
- Drag the corner of the chart to make it bigger.
Add a List Widget
A widget is a basic building block of a dashboard. You add a widget to your dashboard to perform a certain function. Functions might include showing key performance indicators, filtering dashboard results, visualizing data using interactive charts, or showing record-level details in tables. Here, you add a list widget to give dashboard users the power to facet all the charts in the dashboard.
- From the widget icons on the left, drag
 onto an empty space on the dashboard.
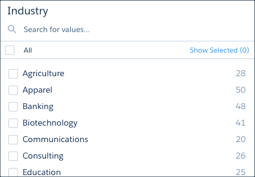
- Click
 and then select Industry.
- Click Create.
- Click the list widget to select it.
- In the Properties panel on the right, click the Query tab.
- Verify that Apply global filters and Broadcast selections as facets are both selected.
- Under Selection Type, select Multiple Selection.
- On your dashboard, resize the list widget to make it bigger.
- Click
 to save your dashboard.
- Enter
My Amazing Dashboardfor the title of your new dashboard, and select App -> My Amazing App.
- Click Save.
Add a Conversational Query
A conversational query starts with a word or two from you, and then CRM Analytics provides suggestions that you can accept or edit. In this section, you see how quickly you can hold a conversation with your data, and then add the results to the dashboard.
- Switch back to the browser tab where your Developer Edition org is open to Setup Home.
- In the Quick Find box, enter
Analytics, and select Settings.
- Make sure that Enable Conversational Exploration is enabled. If it isn’t enabled, select it and click Save.
- Switch to the tab with Analytics Studio, and refresh the browser page.
- If you’re not already there, open My Amazing Dashboard and make sure that you’re in edit mode, not preview mode. You should see Dashboard Designer near your dashboard name. If not, click the Edit button.
- In the dashboard header controls, at the top right of the tab, click
 to open the menu and select Conversations. (If the Choose Dataset dialog appears, select DTC Opportunity.)
- Click in the text entry box, type
top 10 amounts by opportunity name, and press Enter.
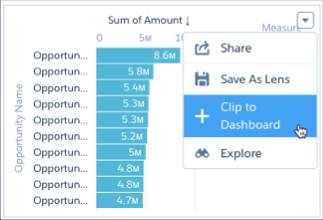
- From the menu on the new chart, select Clip to Dashboard.
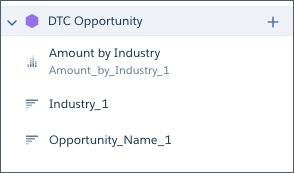
The new query, Opportunity_Name_1, that you just clipped to the dashboard displays in the list of queries.
- From the widget icons on the left, drag
 onto the dashboard.
- From the queries list, drag Opportunity_Name_1 and drop it on the empty table widget.
- Click
 to save your dashboard.
- Verify it’s named
My Amazing Dashboardand that it’s in My Amazing App, and click Save.
Now that you’ve created your dashboard with a conversational query, you’re ready to apply conditional formatting and annotate a saved view. It’s time to start sharing data insights with others in your org.

Resources
- Salesforce Help: Build CRM Analytics Dashboards
- Trailhead: CRM Analytics Dashboard Building Basics
- Video: Get Quick Answers from Your Data with Conversational Exploration
- Salesforce Help: Learn CRM Analytics with In-App Examples