Visualize Your Data
Follow Along with Trail Together
Want to follow along with an expert as you work through this step? Take a look at this video, part of the Trail Together series.
(This clip starts at the 54:25 minute mark, in case you want to rewind and watch the beginning of the step again.)

Report Charts
When it comes to reports and analyzing what seems like endless data, it can be information overload. What if there was an easy way to get a visual summary of all that information? Enter report charts and dashboards.
The Lightning Experience offers enhanced data charts to summarize reported data. You can adjust the chart type without making changes to the report itself.
Let’s see charts in action. Your CEO is so impressed with the work you’ve done, he’s asked for something special. He wants a way to display sales rep performance graphically.
Add a vertical bar chart to compare sales rep win rates:
- Click the Reports tab.
- Click on Sales Rep Win Rates then click Add Chart
 to display a chart.
- Click the gear icon
 in the upper right corner of the chart to open the chart editor.
- Click Column
 to change the display to a vertical bar chart.
- Complete the chart attributes:
- Chart Title:
Sales Rep Win Rates - Click the Y-Axis dropdown and set to Win Rate
- Click the gear icon
 to close the chart editor.
- Click the arrow
 next to Edit and choose Save from the dropdown.
Dashboards
Let’s take visualizing data a step further. The VP of Sales would like a Global Sales dashboard that lets her see the key information at a glance. A dashboard is a visual representation of data from multiple reports and does the following:
- Displays data from custom source reports
- Has a running user to determine what data is visible
- Displays data as of the last time the dashboard was refreshed
- Can be scheduled to be refreshed and emailed automatically
The dashboard editor in Lightning Experience gives you a responsive way of creating or editing dashboards using drag-and-drop. Let’s take a look.
Create the Global Sales dashboard:
- Click the Dashboards tab.
- Click New Dashboard.
- Set the Name to
Global Sales Dashboard.
- Click Select Folder, choose the Global Sales Dashboards, then click Select Folder.
- Click Create.
Add an Opportunities by Rep chart component:
- Click +Widget. Select Chart or Table.
- In the report search bar, enter
Opportunities, click Opportunities by Rep, then click Select.
- From the Display As menu, click the Vertical Bar Chart
 option.
- Ensure the Y-Axis is set to Record Count.
- Ensure the Show Values box is selected.
- Complete the text areas:
- Title:
Sales Pipeline - Subtitle:
Number of Open Opportunities by Rep
- Click Add.
- Click Save.
Add Opportunities by Rep metric component:
- Click +Widget. Select Chart or Table.
- In the report search bar, enter
Opportunities, click Opportunities by Rep, then click Select.
- From the Display As menu, select the Metric
 option.
- Ensure Measure is set to Sum of Amount and Display Units is set to Shortened Number. In the Segment Range, replace the default value of 33 with
1000000(that's 1 million, as in six zeros after the one) and replace 67 with3000000(three million).
- Complete the text areas:
- Title:
Total Open Opportunities - Footer:
Value of open opps in sales pipeline
- Click Add.
- Drag the metric component to the right of the Opps by Rep vertical bar chart.
- Click Save.
Add the Sales Rep Win Rates table component:
- Click +Widget. Select Chart or Table.
- In the report search bar, enter
Sales Rep, click Sales Rep Win Rates, then click Select.
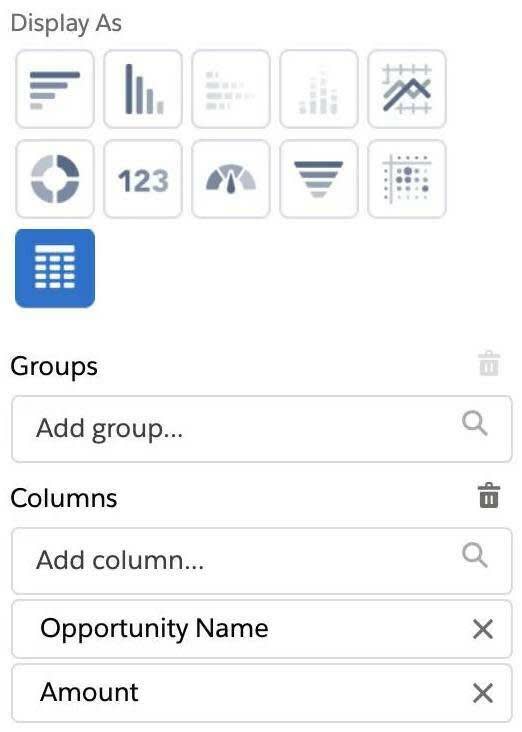
- Select Lightning Table
 from the Display As menu.
- In the Columns section, click the following columns to remove them from this component:
- Account Name
- Stage
- Probability (%)
Note: Opportunity Name and Amount should be the only remaining columns.
- Update the Title to
Opportunities Won.
- Click Add.
- Drag the Opportunities Won table to the right of the Total Open Opportunities metric, to create a third dashboard column.
- Click Save.
Add Sales Rep Win Rates gauge component:
- Click +Widget. Select Chart or Table.
- In the report search bar, enter
Sales Rep, click Sales Rep Win Rates, and then click Select.
- From the Display As menu, select the Gauge Component
 option. Leave the segment ranges set as is.
- Change the Measure to Win Rate.
- Complete the text areas.
- Title:
Company Win Rate - Footer:
Ratio of won to closed opps
- Click Add.
- Drag the Company Win Rate gauge to the right of the Opportunities Won component, to create a fourth dashboard column.
- You will need to resize the chart components to create four columns. Don't worry, component arrangement on your dashboard is not checked when verifying this step.
- Click Save.
- Click Done.

Congrats! You made it simpler for your stakeholders to review their Salesforce data with ease and efficiency. You harnessed the power of Report Builder to customize Salesforce objects and fields into meaningful information. Filters, report types, charts, and dashboards further segmented your data so only the most important information was presented. Great job—you just saved your executive team a lot of time and energy!