Group and Categorize Your Data
Follow Along with Trail Together
Want to follow along with an expert as you work through this step? Take a look at this video, part of the Trail Together series.
(This clip starts at the 36:23 minute mark, in case you want to rewind and watch the beginning of the step again.)
Group Data in Reports
One of the things that makes the Report Builder super easy to use is the ability to easily drag groupings to move them between rows and columns in reports. We use a matrix style report to display summaries from two or more levels of groupings in a grid. This allows you to display more data in a smaller space and makes quick comparisons across groups.
Let’s get back to your VP of Sales who would like the Opportunities by Rep report to show opportunities additionally grouped by Close Date and displayed in a table. No problem!
We’ll modify the Opportunities by Rep report to group by the calendar month of the Close Date.
- Click the Reports tab.
- Click All Folders.
- Click Global Sales Reports.
- Click the arrow
 next to Opportunities by Rep, and select Edit.
- Ensure the Opportunity Owner column is grouped by row.
Note: If there is a number in parentheses next to the Opportunity Owner name, the column is grouped. If not, click the arrow next to the Opportunity Owner column heading and then select Group Rows by This Field.
- In the Preview pane, click the arrow
 next to Close Date and select Group Columns by This Field.
- Click the arrow
 in the Close Date summary row, hover over Group Date By, and then select Calendar Month.

- At the bottom of the Preview pane slide the toggle next to Detail Rows to deselect.
- Click the arrow
 next to Save, and click Save As, then complete the Save Report details:
- Report Name:
Opportunities by Rep and Close Month - Click in the Report Unique Name text box to auto-populate the unique name. Don't worry, the unique name of this report isn't checked.
- Report Description:
What opportunities do your sales reps have in the pipeline and when do they close?
- Ensure that this report is being saved in the Global Sales Reports.
- Click Save.
- Click Run.
Use Bucket Fields
Matrix reports are a useful way to view data, but what if you need to organize your groupings by categories? That’s where bucketing comes in. Bucketing lets you segment your report data on the fly by defining a set of categories, or “buckets,” to sort, group, or filter the records.
Let’s check out how bucketing works and fulfill one of your VP of Sales’ reporting needs. We’ll create a matrix report again, but this time show opportunities by owner, stage, and size in the pipeline this Fiscal Quarter.
Create a new Opportunity report:
- Click Reports.
- Click New Report.
- Under Recently Used on the left, click All.
- In Search Report Types, enter
Opportunitiesand select Opportunities.
- Click Start Report.
- Ensure Update Preview Automatically is enabled in the upper-right of the Report Builder.
- Click the Filters pane.
- Ensure Close Date is set to Current FQ.
- Click Opportunity Status, select Open then click Apply.
- Click the Outline pane and click the X next to the following column headers to remove them:
- Owner Role
- Fiscal Period
- Age
- Created Date
- Next Step
- Lead Source
- Type
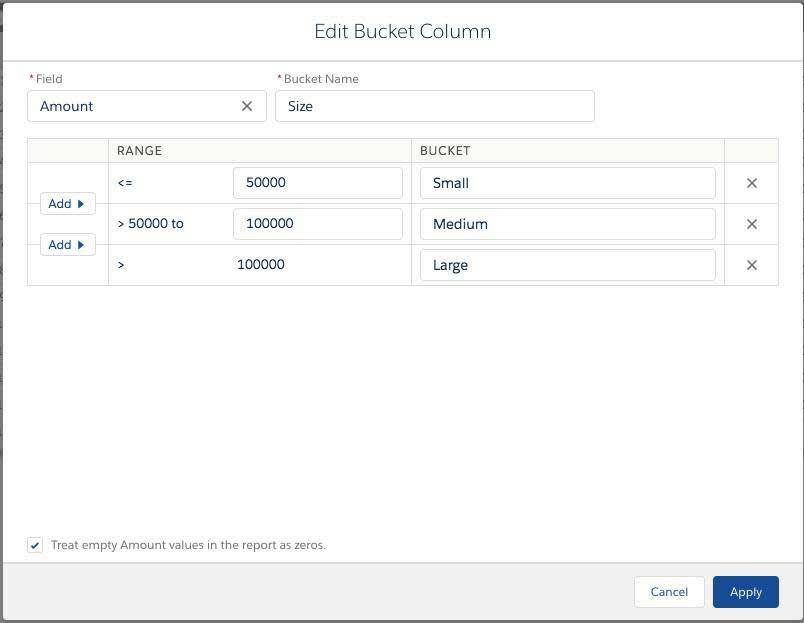
Add a bucket field to categorize the opportunities as small, medium, or large:
- In the Outline pane, click the arrow
 next to Columns and click Add Bucket Column.
- Remove current selection within the Field box, then search for and select Amount.
- For Bucket Name, enter
Size.
- Complete the first range as follows:
- Range: <=
50000 - Name:
Small
- Click Add, then complete the second range:
- Range: > 50,000 to
100000 - Name:
Medium
- For the third range (> 100,000), in the Name field enter
Large.
- Ensure Treat empty Amount values in the report as zeros is selected.

- Click Apply.
Group the report by Stage and Opportunity Owner, and by Size:
- In the Preview pane, click the arrow
 next to Opportunity Owner and select Group Rows by This Field.
- In the Preview pane, click the arrow
 next to Stage and select Group Rows by This Field.
- Click the arrow
 next to Size and select Group Columns by This Field.
- At the bottom of the Preview pane, slide the toggle next to Detail Rows, Subtotals, and Grand Total to deselect them.
- Click Save & Run and complete the report details:
- Report Name:
Pipeline Matrix Report Current FQ - Click in the Report Unique Name text box to auto-populate the unique name. Don't worry, the unique name of this report isn't checked.
- Report Description:
How big are the deals at each stage in the pipeline this FQ?
- Click Select Folder, choose Global Sales Reports, and click Select Folder.
- Click Save.
