Learn How Data Is Organized
Learning Objectives
After completing this unit, you’ll be able to:
- Describe how well-structured data is organized.
- Differentiate between well-structured data and poorly formatted data.
Introduction
In the previous unit, you learned some characteristics of high-quality, useful data. Two traits that pertain specifically to data organization are dimensionally structured and atomic. Dimensionally structured data is organized into two types: Dimensions (qualitative values) and Measures (quantitative values). This is the organizational structure Tableau uses when interpreting data. Data that is atomic is finely detailed enabling you to analyze the data at various levels of detail.
When data is organized it is easier to analyze since it can be examined, summarized, searched, and filtered in many different ways. Unorganized data is often limited to how it can be analyzed. For example, if data is already summarized by month, then daily or weekly trends can’t be examined.
In this unit, you learn how well-structured data is organized.
Data Organization
Data is organized into rows and columns.
- Columns are vertical, and each column represents a different variable (or field). The Data Literacy Basics module defines a variable as a measurement, property, or characteristic of an item that may vary or change. In the Tableau Platform, variables are called fields.
- Rows are horizontal, and each row represents one unit of analysis. In the Tableau Platform, the units of analysis are called values.
Let's look at an example. Think of a few of your family members or friends, and create a table using the variables (or fields): name, age, height, and favorite food. Your table might look something like the one below.
| Name | Age | Height (inches) | Favorite food |
|---|---|---|---|
|
Aliya |
8 |
50" |
Ice cream |
|
Miles |
12 |
63" |
Olive pizza |
|
Penny |
42 |
67" |
Corn on the cob |
|
Vince |
39 |
70" |
Pancakes |
As you can see, the variables (or fields) are organized into columns, one each for Name, Age, Height, and Favorite food. Each row represents one unit of analysis (or value). In this case, reading across any row tells you the name, age, height, and favorite food of one person. For example, Aliya is 8 years old, 50" tall, and enjoys ice cream.
The Organization of “Good” Data
“Good” data is well-structured data and is organized this way.
- Each variable (field) is in one column, with a column header.
- Each different observation of that variable (value) is in a different row.
For example, look at this simple table. The variables (fields) are Vendor, City, and State, and each one exists in its own column with a column header. Each row lists the observations of the variables (values), in this case, the vendor name and location by city and state. Having the vendor’s state in its own column enables searching and filtering vendors by state. If the vendor’s city and state were combined into one field, this type of analysis would be more difficult.
| Vendor | City | State |
|---|---|---|
|
Polly’s Lollipops |
Preston |
WA |
|
Lucy’s Lollies |
Lansing |
MI |
|
Carlo Callazo’s Candy |
Cambridge |
MA |
|
Ming’s Minty Meringues |
Madison |
WI |
Poorly Formatted Data
Poorly formatted data contains certain characteristics that cause clutter in data or can make data difficult for software programs, including Tableau, to interpret. Some of these issues include:
- Variables (fields) are not in one column each, with a column header.
- Each different observation of the variable (values) is not in a different row.
- Titles are formatted as rows above the column headers or as extra columns.
- There are extra columns and rows.
- Column headers are formatted as subtitles and not in the first row.
For example, here’s a poorly formatted table, which documents the average number of movies that a sample of 16,000 people in California and New York saw in 2019.
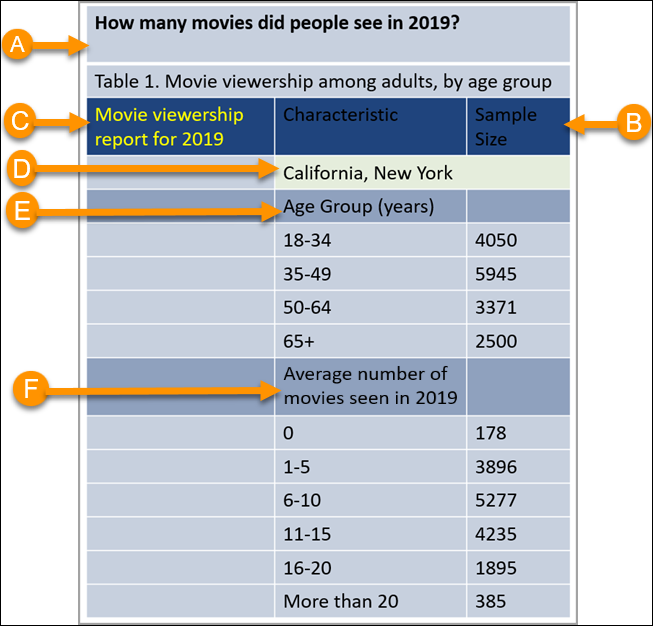
Do you notice any of the characteristics of poorly formatted data listed above?
- A. Titles in rows: The first row should contain column headers only. This row and the one below it are titles, not column headers.
- B. Column headers in third row: Despite being highlighted, the Characteristic and Sample Size cells will not be read as column headers by most software programs, including Tableau.
- C. Extra column: This is the title of the report, but it is formatted as its own column.
- D. Extra row: State is a variable (field) and should be its own column, with a column header, not a row.
- E. (and F.) Variable (field) as a subtitle: Subtitles (Age Group, Average number of movies seen in 2019) in this column are variables (fields) that should exist in their own columns.

You now know how data is organized, and the difference between well-structured and poorly formatted data. In the next unit, explore some ways to restructure poorly formatted data.