Identify Data Characteristics
Learning Objectives
After completing this unit, you’ll be able to:
- Identify characteristics of useful data.
- Recognize characteristics of useful data in example data.
Introduction
People often use data by analyzing it to help make decisions. Do you know how to tell when your data is ready for analysis? In this module, you learn how to recognize “good” data, and how to restructure data when needed.
In this unit, you learn how to recognize the traits of high-quality, useful data. Data that has these traits enable you to perform efficient and productive analysis.
The Data Literacy Basics module discusses characteristics that prominent information technologist Stephen Few identified as traits that help people to work effectively with data. Just as people who work effectively with data have specific attributes, effective data has specific characteristics that make it useful. And according to Stephen Few, working with high-quality data is an essential part of data analysis that leads to important insights.
Stephen Few is recognized as a leader in the field of data visualization, and these traits have been adapted with permission from his book, Now You See It: An Introduction to Visual Data Sensemaking.
Traits of Useful Data
Few compiled a list of traits that can be found in useful data. As you read through these characteristics, reflect on your own experience. Have you encountered data that was useful in your personal or work life? Which of these traits did that data have? Have you encountered data that was not useful in your personal or work life? Which of these traits did that data lack?
These are some of the traits of high-quality data.
| Traits |
Description |
|---|---|
|
High Volume |
A large amount of relevant, available data means that there’s a better chance you'll have what you need to answer your questions. Note: There is no need to simply acquire data for its own sake; relevancy is important. |
|
Historical |
Data that goes back in time allows you to see how the present situation arose due to patterns that have arisen over time, such as looking at sales trends over the last 10 years to see increases or decreases. |
|
Consistent |
As things change, data should be adjusted for consistency. Salary and price data adjusted for inflation is a good example of this. |
|
Multivariate |
Data should contain both quantitative (numerically measurable) and qualitative (characteristic, not numerically measurable) variables. The more variables in the data, the more you can discover from it. |
|
Atomic |
The more finely detailed the data, the more you are able to examine it at various levels of detail. For example, if you wanted to understand bicycle riding trends in your state, it would be helpful to see these trends as impacted by county, city, and neighborhood. |
|
Clean |
In order for data to be useful, it should be accurate, complete, and free from errors. |
|
Clear |
Data should be written in terms that can be easily understood, not in code. For example, the housing type values single family, two-family conversion, and end-unit townhouse are much easier to understand than 1Fam, 2fmCon, and TwnhsE. |
|
Dimensionally Structured |
An accessible way to structure data is to organize it into two types: Dimensions (qualitative values) and Measures (quantitative values). This is the organizational structure Tableau uses when interpreting data. |
|
Richly Segmented |
Groups, based on similar characteristics, should be built into data for easier analysis. For example, data about movies could be grouped by genre (action, science fiction, romance, comedy, and so on). |
|
Of Known Pedigree |
In order to trust the data, you should know its background—where it comes from and how it has since been altered. |
Consider Some Example Data
Imagine that you have an Excel file called “January-reactors-operating” that was downloaded from Data.gov, a website where you can access the United States government’s open data. The file contains information about locations and power capacities of nuclear reactors in the United States. This image offers a snapshot of the first 16 rows of the data.
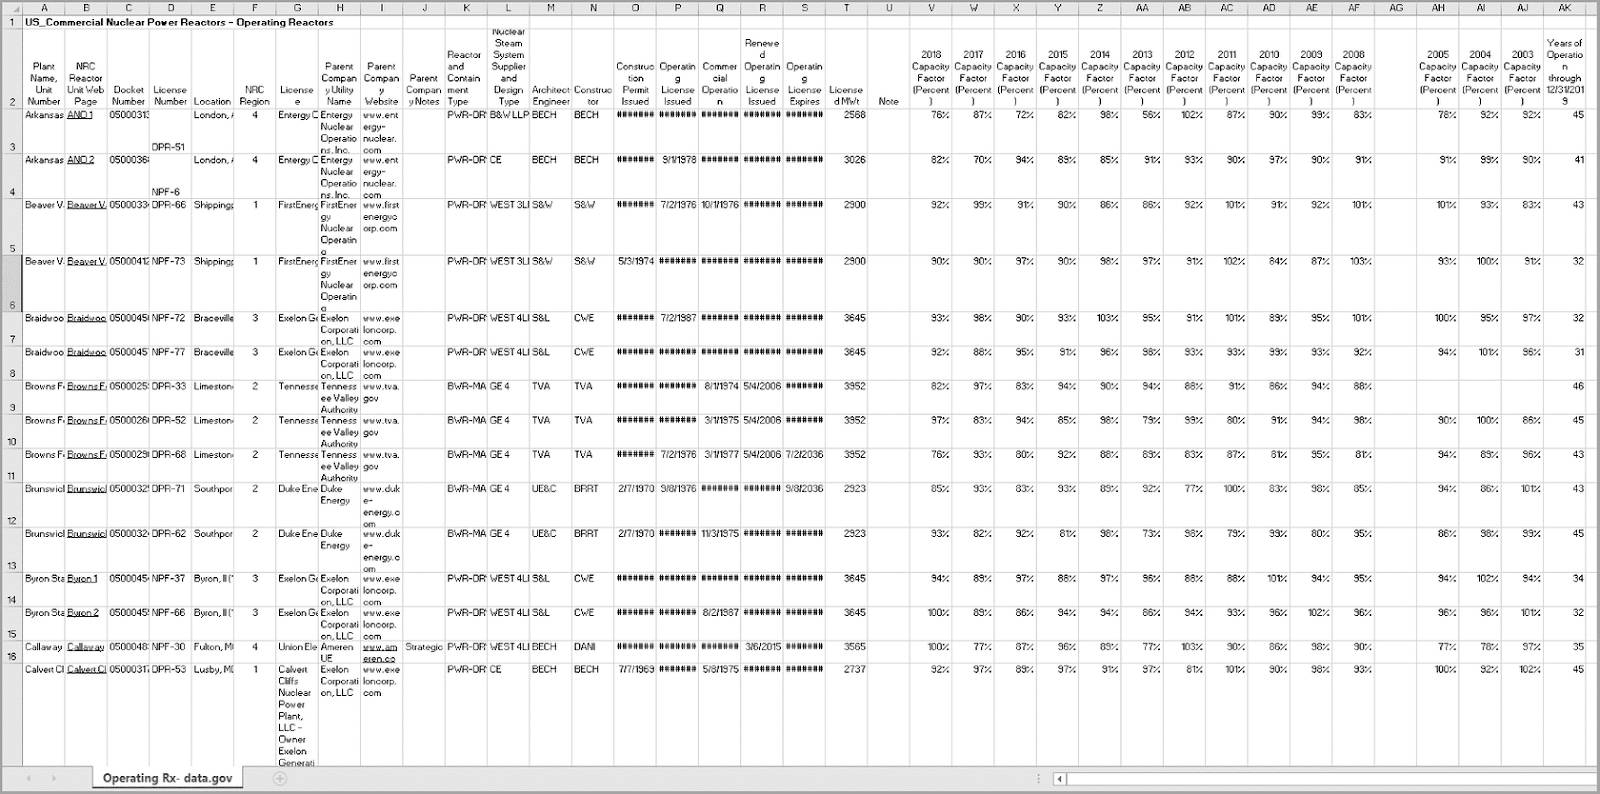
Think about the traits of useful data. You know this data set comes from Data.gov, a website where you can access the United States government’s open data, and you see that it contains data for the years 2003 to 2018. Let’s test what you just learned. Which two traits of useful data are represented? In the activity below, fill in the blanks of each sentence.
Now you have an understanding of some traits of effective data. In the next unit, learn how data is organized, and the difference between well-structured and poorly formatted data.
Resources
- Book: Few, S. (2021). Now You See It: An Introduction to Visual Data Sensemaking (2nd ed). Analytics Press.
- Website: Perceptual Edge, Stephen Few’s professional website