Add Selectors That Allow Users to Filter the Dashboard Results
Learning Objectives
After completing this unit, you’ll be able to:
- List the four types of selection-based filter widgets.
- Add global filters to a dashboard.
Explore Filters in Analytics Dashboards
Add filter widgets to a dashboard to give users the ability to slice and dice the data to view results from different angles. For example, you can filter the dashboard results to focus on a specific sales rep or product line. There are two types of filter widgets.
-
Global filter panel widgets
- You can add multiple global filters in a global filter panel widget. Use a global filter to apply the same filter to multiple queries in the dashboard. For example, if the dashboard has a separate chart for each rep to compare their performance, use the same filters for all charts so you’re comparing apples to apples. You can specify which queries to apply the global filters to and enable the users to change the filters while viewing the dashboard.
-
Selection-based widgets
- Like global filters, filters in selection-based widgets can be changed by users viewing the dashboard. Unlike global filter widgets, selections in these widgets can also trigger selection bindings, which can dynamically change other query parameters (like measures and groupings) or widget properties (like reference lines).
We’ll cover bindings in the next unit. The dashboard designer provides four types of selection-based widgets: date, list, range, and toggle.
- Use a date widget to filter on a date.
- Use a list or toggle widget to filter on a dimension.
- Use a range widget to filter on a measure.
In this unit, we use global filters to enable Laura and sales reps to answer different questions without leaving the dashboard.
How Well Is Each Sales Rep Performing?
To view the performance of each rep, Laura needs to be able to filter the dashboard results by rep. For example, to help Dennis meet quota, Laura needs to see the value of his open and won opportunities and see his opportunity records.
Let’s add a filter on sales rep.
- While in edit mode, drag the Filter widget on top of the chart in the dashboard canvas. Notice the red box. This box shows the default size of the chart widget. It’s red to indicate that you can’t place it here. Widgets can’t overlap on a dashboard.

- While dragging the widget, tap Shift to enable reflow, which moves existing widgets down to make room. Then place the panel widget between the Sales Performance text widget and the chart widget. Expand the filter widget across the dashboard.

- To enable users to filter on the sales rep, click the Filter widget, select the DTC Opportunity dataset and the Opportunity Owner field.
- Click Create to create a filter based on this dataset field.
- In the Filter widget properties on the right, select All Global Filters.
- Save the changes to the dashboard. Awesome. Those viewing the dashboard can now use this filter to focus on a particular rep.

What Does the Pipeline Look Like?
By analyzing the different pipeline stages for each rep, Laura can verify whether there’s enough opportunity at each stage so that the pipe doesn’t dry up. She can also help reps move their leads to closed deals and find out who already made quota based on the Closed Won stage.
- In the filter widget panel, click Manage Global Filters.
- Click the plus sign next to the DTC Opportunity dataset. Select Stage and then click Create.
- Save the dashboard.
In the next section, you’ll add a filter so Laura can analyze each product line.
How Is Each Product Line Doing?
You already created filters for opportunity owner and stage, but being able to filter by product family can help your sales team focus on the sales for each product line. Add another global filter based on the Product Family field. Like the previous filters, don’t make any filter selections. In the next section, you’ll add a filter on deal size so Laura and reps can focus on the more lucrative opportunities.
How Much Are These Opportunities Worth?
Let’s build a filter based on the Amount measure so reps can focus on the deals that can help them meet quota the fastest—the million-dollar-plus ones.
- Add another global filter based on the Amount field.
- Click Manage Global Filters (Note: click on one of the existing filters to access Manage Global Filters).
- Click the plus sign next to the DTC Opportunity dataset. Select Amount and then click Create.
- Click the filter widget to go back to widget properties.
- Select Show Title to add a filter title and bundle the global filters.
- To get rid of the extra space to the right of the global filters in the panel widget, set Filters per Row widget property to 4. Resize filter, chart, and metrics to fit everything on the dashboard.

- Save the dashboard.
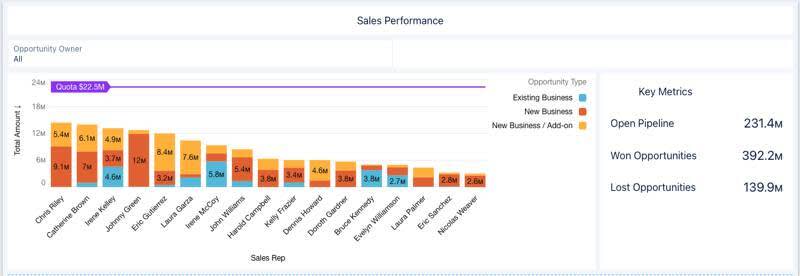
Previously, you helped Laura determine the open, won, and lost opportunity amounts for the entire team. You also created a chart that ranks reps and identifies low performers. And you created a table that shows details about each opportunity record.
Now, Laura can analyze all of this information by rep, stage, product family, and opportunity amount because of the global filters that you added. With the tools you’ve built, she can track the progress of each member of her team. For example, she can use the filters to view Irene Kelley’s won opportunities that are worth more than $250,000. With those won opportunities alone, looks like Irene already qualifies for the trip to Bora Bora—time for her to start packing her bags! 
In the next unit, you learn how these widgets interact with each other to change the focus of the dashboard, so you can analyze your business from different angles.
Resources
- Help: Add Selection-Based Filter Widgets to Enable Users to Filter the Results
- Help: Add a Global Filter Panel Widget to Filter Data from the Dashboard