Get to Know Tableau Pulse
Learning Objectives
After completing this unit, you’ll be able to:
- Describe what Tableau Pulse is.
- Explain how Tableau Pulse differs from other Tableau offerings.
What Is Tableau Pulse?
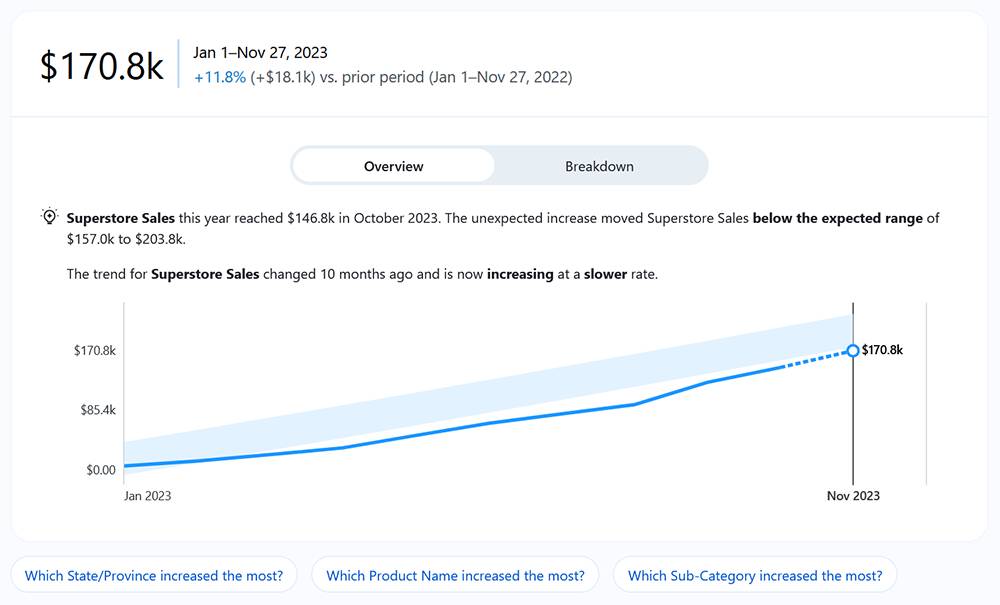
Tableau Pulse helps you track the metrics that matter most to you and your business. It delivers personalized, contextual insights directly where you work. These insights give you the information you need to make data-driven decisions.
Tableau Pulse provides data insights based on metrics that you define. After you create a metric, you can add members of your organization as followers. Followers receive a regular email or Slack digest about their data. This digest surfaces trends, outliers, and other changes, keeping followers up to date on the data relevant to their work. To learn more about the data, followers can investigate a metric on Tableau Cloud and see how different factors contribute to changes in the data.
For an overview of the features and benefits of Tableau Pulse, check out the Tableau Pulse: Quick Look or view this quick video.
A Reimagined Data Experience
Tableau Pulse simplifies the process to create metrics. Instead of building complex calculations in traditional Tableau viz authoring, with Tableau Pulse, you can make a metric definition with only a few selections. Members of your organization use that metric definition as a jumping-off point to make metrics, by slicing the data based on different dimensions or time periods. Because Tableau Pulse sends insights about these metrics directly to followers, your colleagues get the data they need in their flow of work.
With Tableau Pulse, users have an easy, self-service way to take part in guided data exploration. They can ask suggested questions to see how different dimensions affect the data. This guided exploration complements the more free-form analysis that’s possible with the traditional Tableau viz authoring experience and allows users unfamiliar with Tableau analysis to understand their data.
Enable a Smarter, More Efficient Workflow
Jamal is a data analyst at Main Stage Analytics. Part of his job is to ensure that sales reps in his organization have access to the right numbers, so they can track sales specific to their territories and product lines.
Before adopting Tableau Pulse, Jamal had to create custom dashboards, which he needed to edit every time a new rep joined the team. With Tableau Pulse, Jamal simply creates a single metric definition that includes the core value of the sum of daily sales with adjustable metric filters for territory and product line.
Based on this definition, Jamal can create as many metrics as he needs with just a few clicks. Each time a new sales rep joins his organization, he adjusts the filters for territory and product line to create metrics scoped to the needs of that sales rep.
He adds individual sales reps as followers to the metrics that cover where and what they sell. These reps have quick access to their metrics in Tableau Mobile and receive digests with data insights directly in the tools they already use for their daily work. Now everyone in Jamal’s organization can easily stay informed about their performance and swiftly take any actions necessary to meet their goals.
Next, walk through the steps to enable a smarter, more efficient workflow for your organization using Tableau Pulse.