Connect to Your Data
Learning Objectives
After completing this unit, you'll be able to:
- Connect to a data source using Tableau Cloud.
- Prepare your data for analysis.
To start creating content on a Tableau site, you need to connect to a data source. Users with appropriate permissions can connect to data sources that have been published to a Tableau site.

Connect to Published Data Sources
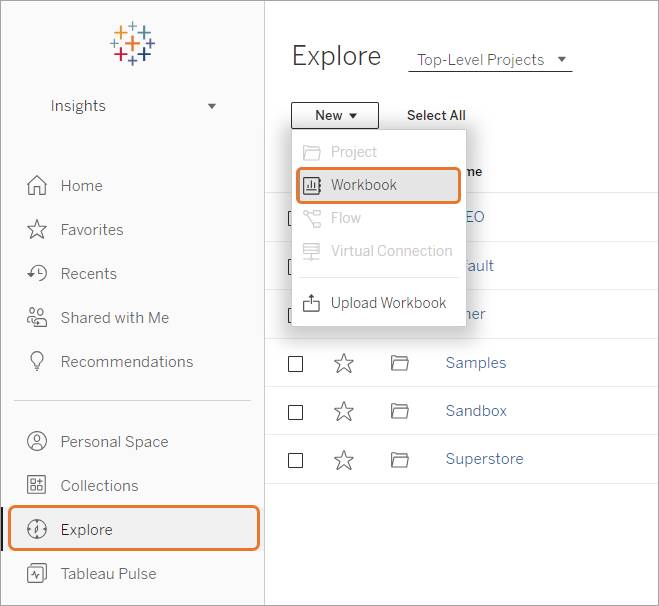
The first step in creating a data connection is to create a new workbook. On the Explore page, click the New | Workbook option.
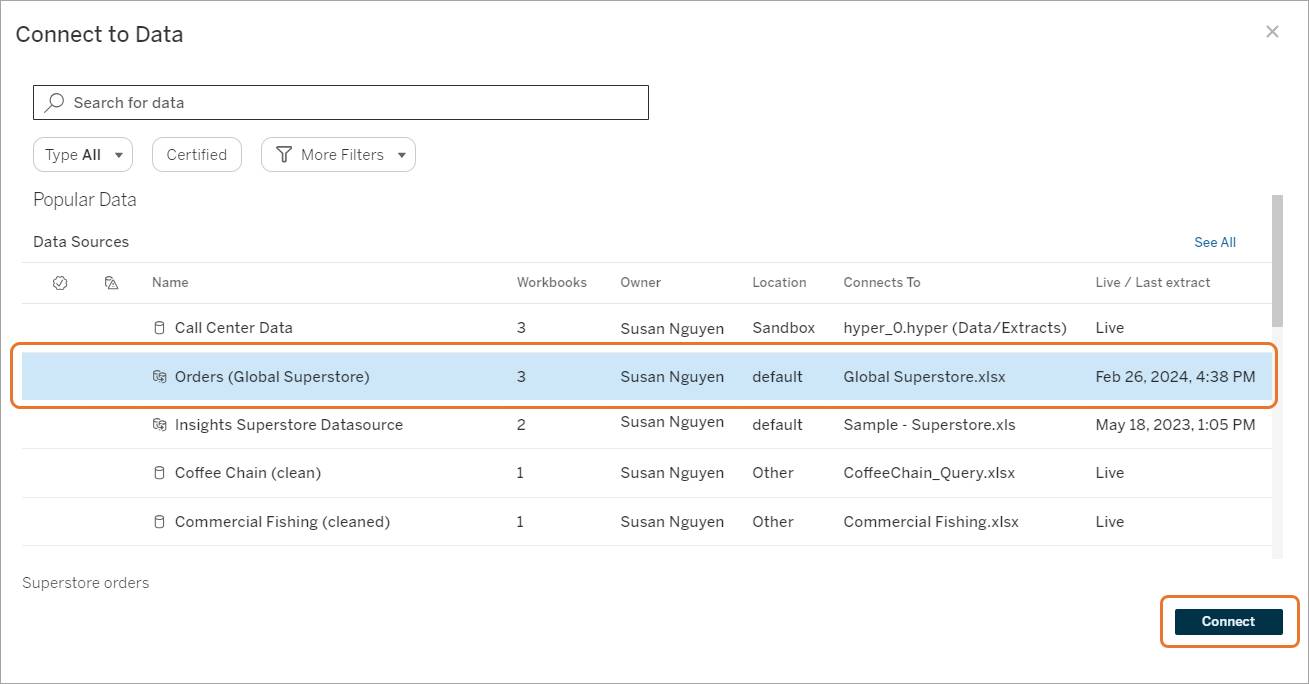
This opens the Connect to Data window. Select the data source you want to connect to and click Connect. If you don’t see the data source you’re looking for, you may not have permissions to view or connect to it.
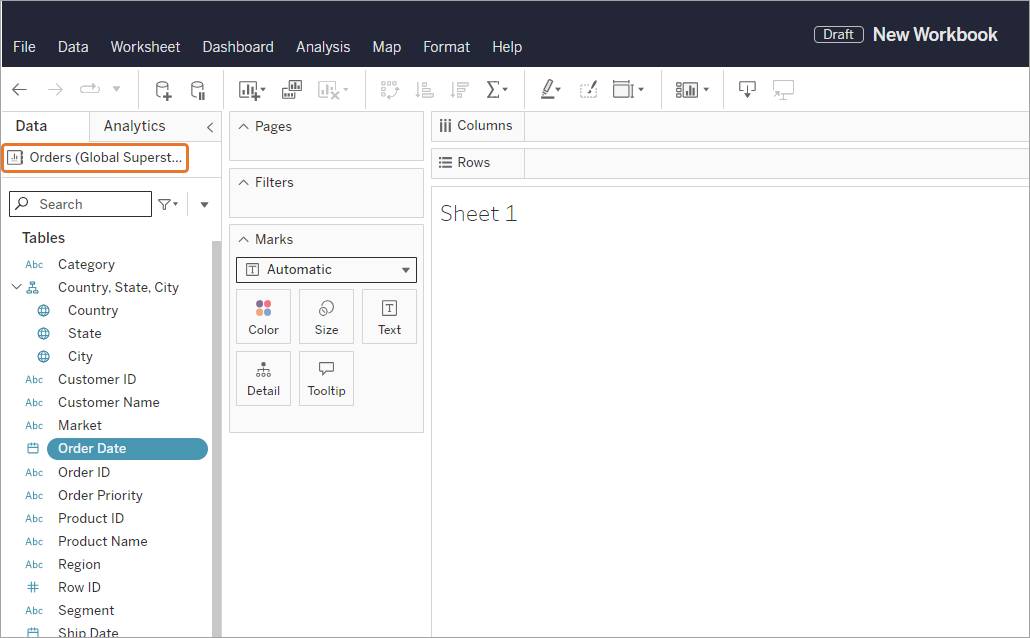
This opens a new workbook, which is connected to the data source.
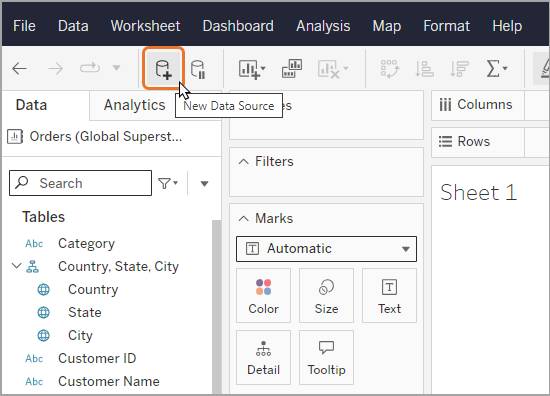
You can also connect to data within a workbook while editing it. In the editing mode, click the New Data Source icon.
Customize Your Data
After connecting to the data, you can customize it by modifying data attributes so that it’s ready for analysis. These changes do not affect the underlying data source.
Ideally, data sources are prepared by a data steward. Explorers should not need to prepare data beyond simple formatting and renaming based upon how they want the data displayed in a visualization.
Customize the Data Source Within the Workbook
When web authoring, you can make changes to a data source within the Data pane of a workbook. The Data pane has many features and functions to help you organize and customize your data fields.These changes impact the way data is displayed within the workbook only. They do not affect the underlying data source. Here are some of the changes you can make.
-
Rename a Field
Rename fields in the Data pane. For example, you could rename a field named Ship Mode in the data source to be Ship Method. Renaming a field does not change the name of the field in the underlying data source; rather, it is given a special name that appears only in Tableau workbooks. The changed field name is saved with the workbook as well as when you export the data source. You can rename any type of field. At the right of the edit field is a small circular arrow that you can click to restore the original data source field name.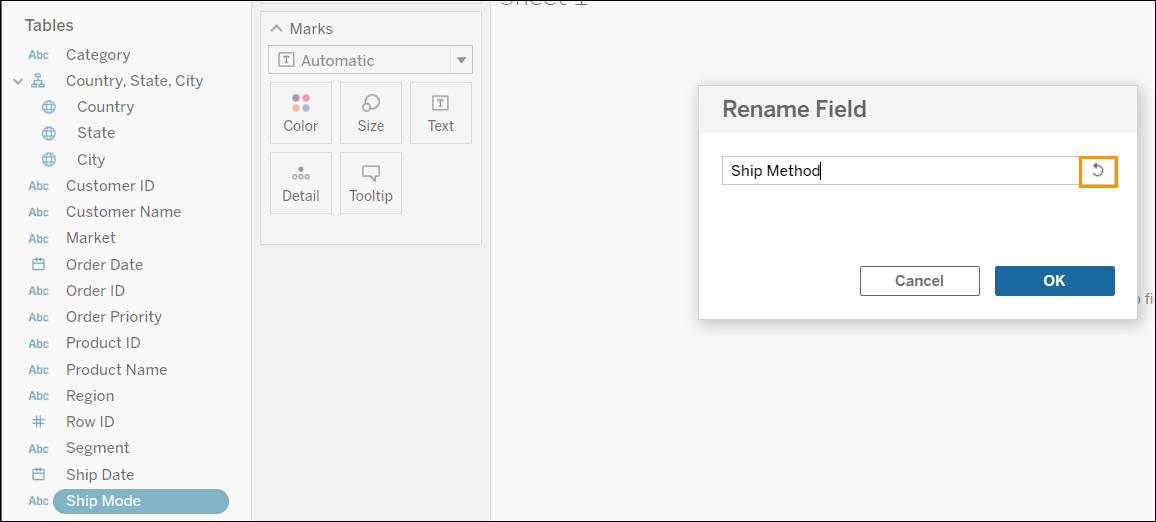
-
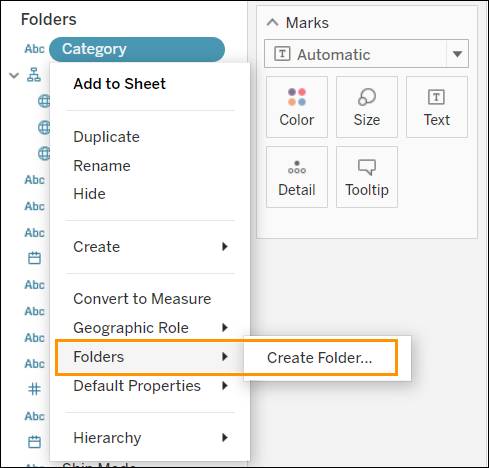
Organize Dimensions and Measures into Folders
Reorganize the items in the Data pane from its default layout using folders.
-
Hide or Unhide Fields
Selectively hide or show fields in the Data pane. To hide a field, right-click (control-click on a Mac) the field and select Hide. When you want to change your fields from hidden to visible, select Show Hidden Fields on the Data pane menu.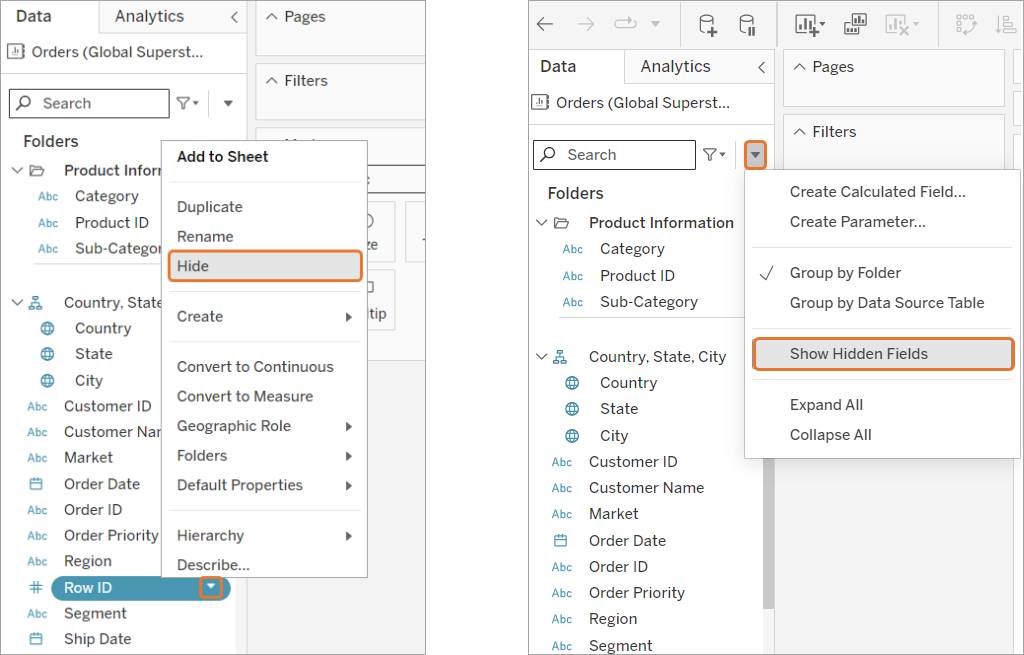
-
Assign a Geographic Role to a Field
Tableau has built-in geographic roles, including City, State/Province, Country/Region, and Zip Code/Postcode. These can be useful when creating maps in Tableau. To assign a geographic role to a field, right-click (control-click on a Mac) the field, select Geographic Role and then select the desired menu option. For example, you can assign the geographic role of Country/Region to the Region field.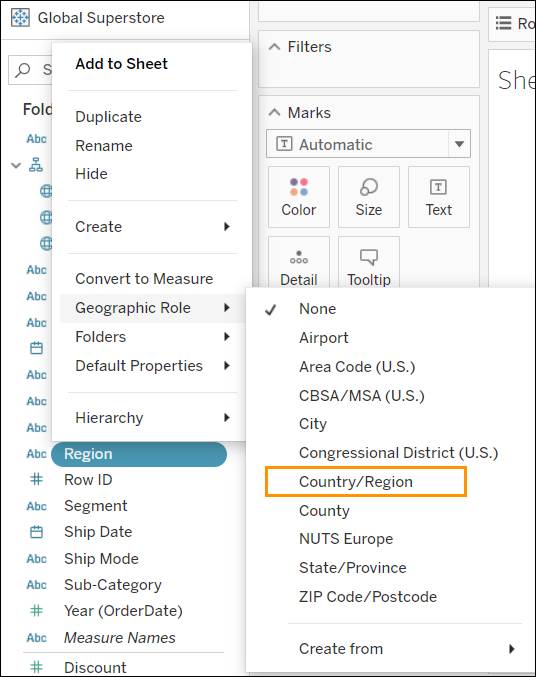
You saw how to modify data attributes in a view in order to customize the format for use in the workbook. Now that your data is organized for analysis within the workbook, you can start building views using the Tableau workspace. But before you do that, let’s practice connecting to a published data source from a workbook on a Tableau site and then customize some data properties using the Trailhead Simulator.
Connecting to and Editing a Data Source
You learned how you can connect to a data source in Tableau Cloud and make any desired customizations to data properties before authoring a view. Now you are ready to connect to your own data source and customize some data for the analysis work you have been tasked with.
If you’ve completed other Tableau modules in Trailhead, you’re probably already familiar with the Trailhead Simulator.
For the best experience, view the Trailhead Simulator on a computer, not a mobile device. Trailhead Simulator is different from a Trailhead Playground. The simulator doesn’t store your progress or any data you enter. If you close your browser, you start from the beginning of the simulation again. You can always use the navigation controls at the bottom of the simulator to get back to where you left off.

Navigation Controls |
Description |
|---|---|
(1) Left Arrow |
Go backward in the simulator. |
(2) Right Arrow |
Go forward in the simulator. |
(3) Scrub Bar |
View your progress, plus you can use the progress arrow to quickly move to a different location within the simulator. |
(4) Close Button |
Exit the simulator. Remember that if you close the simulator, you start from the beginning the next time you launch it. |
When you click in the wrong spot, highlighting shows you where to click.
Let’s get started.
Connect to a Data Source
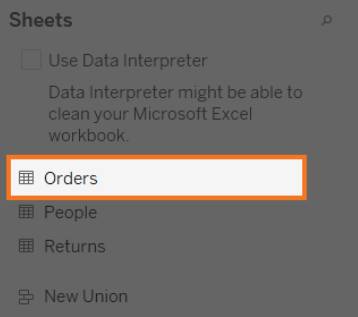
Imagine that you will be starting some analysis work with the company data. The data source you need for the analysis has already been published to your Tableau site by a data steward in the company. The data source is named Sample-Superstore.
- Launch Trailhead Simulator.
- Click Connect to a Data Source.
- Click Begin.
- You are on the Home page of your Tableau Cloud site. Click Explore in the left pane to see all content.
- To open a new workbook, click New, and then click Workbook.
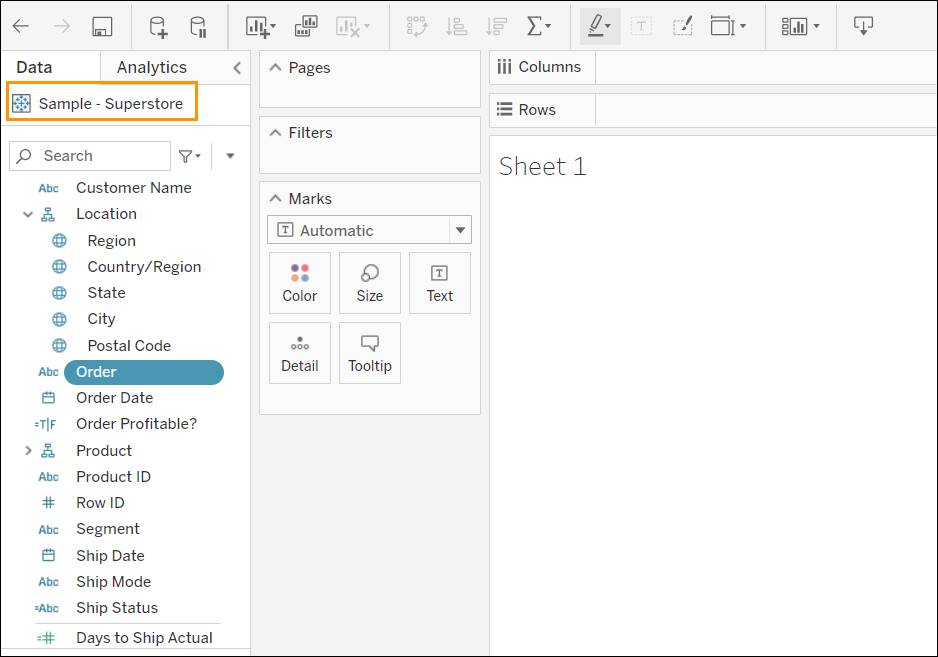
- Connect to Data shows all data sources you have access to. Select Sample- Superstore, and then click Connect. A new workbook opens with a connection to Sample-Superstore.
- Click Next Exercise.
Next, you make changes to the data so that it meets the needs of the analysis you are doing.
Edit a Data Source
Imagine that you are connected to your company data source, but quickly realize that you need to make some changes to the fields to make the data more understandable. You rename the Order Status field to Order Priority and also remove the geographic role for Region.
- Click Begin.
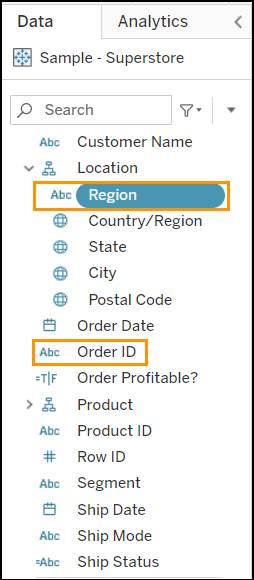
- The workbook connected to Sample-Superstore is open. Change the name of the field Order to Order ID to make it more understandable. Right-click Order.
- From the menu, select Rename.
- In the Rename Field, type
Order IDand then press enter (Windows) or return (Mac).
- Click OK to close the dialog box.
- Next, we remove the geographic data role from the Region field. Right-click Region.
- From the menu, select Geographic Role, and then click None.
You customized some data properties for some fields in your data to help with your analysis. You are now ready to start building views in Tableau Cloud.
- Click Home to restart the activity or Exit to close the simulation.
Resources