Track Your Product Portfolio
Learning Objectives
After completing this unit, you’ll be able to:
- Track key metrics and trends for products and product families that contribute to sales.
- Understand how the products are performing and how accounts and agreements are contributing to product demand.
- Analyze price trends and price elasticity of your products.
Study the Sales Trend
In the last unit, we saw how Vance identified that while Hammer H500 isn’t faring well, Hammer H700 is contributing greatly to the revenue earned from Meridian Partners. Vance wants to analyze Hammer H700 further and see how viable it might be to recommend this product to his accounts in place of Hammer H500.
He opens the Product Performance dashboard and looks at the Sales Trends tab. This tab helps you analyse high-selling and low-selling products. Vance can gauge Hammer H700’s performance at three levels from this tab itself.
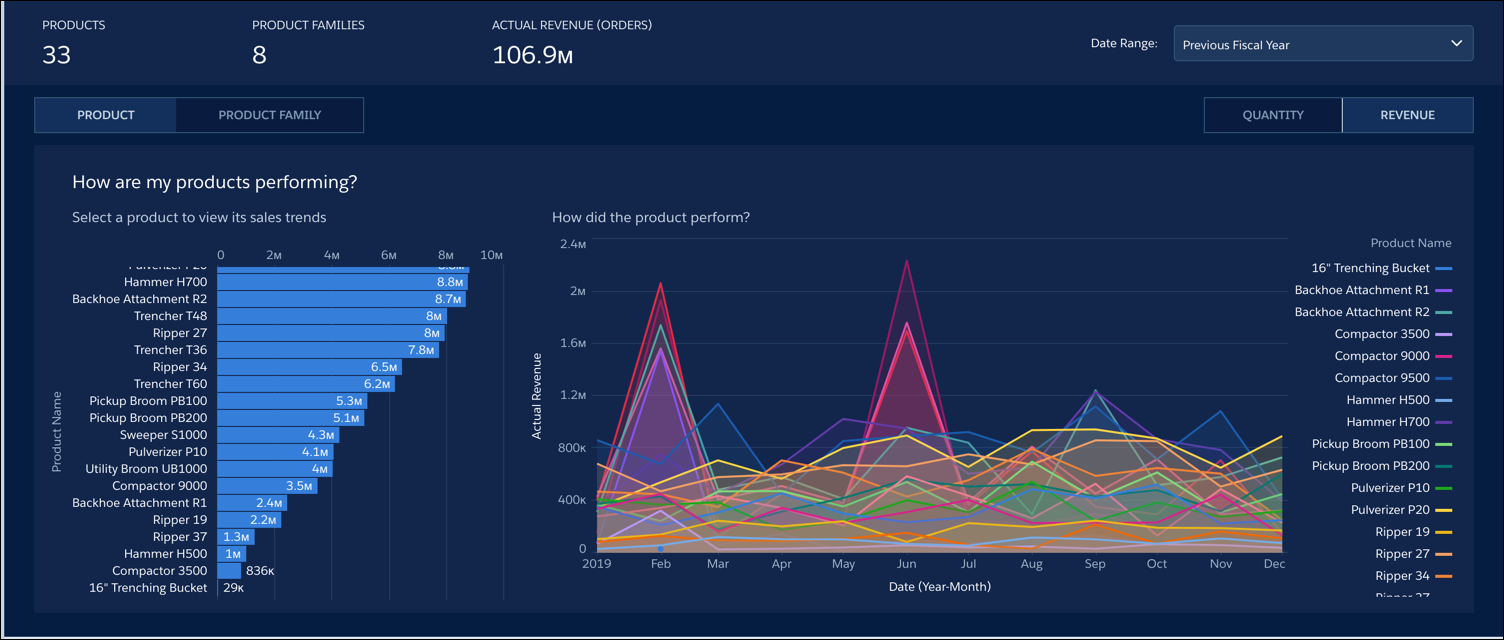
First, he can click the product bar for Hammer H700 to see the line graph for quantity or revenue trend. He can set the time period to All, Current Fiscal Year, Previous Fiscal Year, and so on. Vance selects Previous Fiscal Year as the date range to analyze historical data.
Next, he can see the accounts and related sales agreements that contributed to the sale of the product. The accounts and agreements are sorted from high to low. Vance notes that Momentum Design is another account from where a large part of the revenue was collected for Hammer H700. There’s a mix of active and expired sales agreements where revenue was high for Hammer H700. So Vance selects the account bars for Momentum Design and Meridian Partners to analyze further.

Vance sees that the two active sales agreements in the list that are contributing the most to Hammer H700’s sales are Meridian Partners and Momentum Design. Luckily, Momentum Design is handled by Vance’s teammate. Vance can share notes and get some insights from her on how she planned product sales. Since the two accounts are in the same industry segment, it would help Vance to run some ideas past her.

Bridge the Gap Between Plans and Actuals
Elliott suggests that they do a comparative analysis of the two products across accounts in Rayler Parts. They can then figure out how the actual revenue of the products differs from their planned and forecasted numbers.
Vance opens the Actuals vs Planned tab on the Products Performance dashboard. He sets the date range to Current Fiscal Year, and selects the product bars of Hammer H500 and Hammer H700. A heat map shows him the actual vs planned revenue difference for both the products across six accounts. The color gradient indicates which accounts have a greater difference when it comes to revenue realization.

Vance and his teammate note the following:
- For Meridian Partners, the actual vs planned difference is extremely high for Hammer H500.
- For Momentum Design, the actual vs planned difference for Hammer H700 is significantly less than that of Meridian Partners.
- For Hammer H500, both accounts have a similar difference.
On this tab, they also find the actual revenue vs planned revenue trend graph with the difference highlighted for each month. Rayler Parts has a revenue gap of $9 million in the current fiscal year for Hammer H500 and Hammer H700 across all accounts.

Next, they want to look at how the forecast compares to the actual revenue of the current fiscal year.
Negotiate Orders and Forecast Numbers
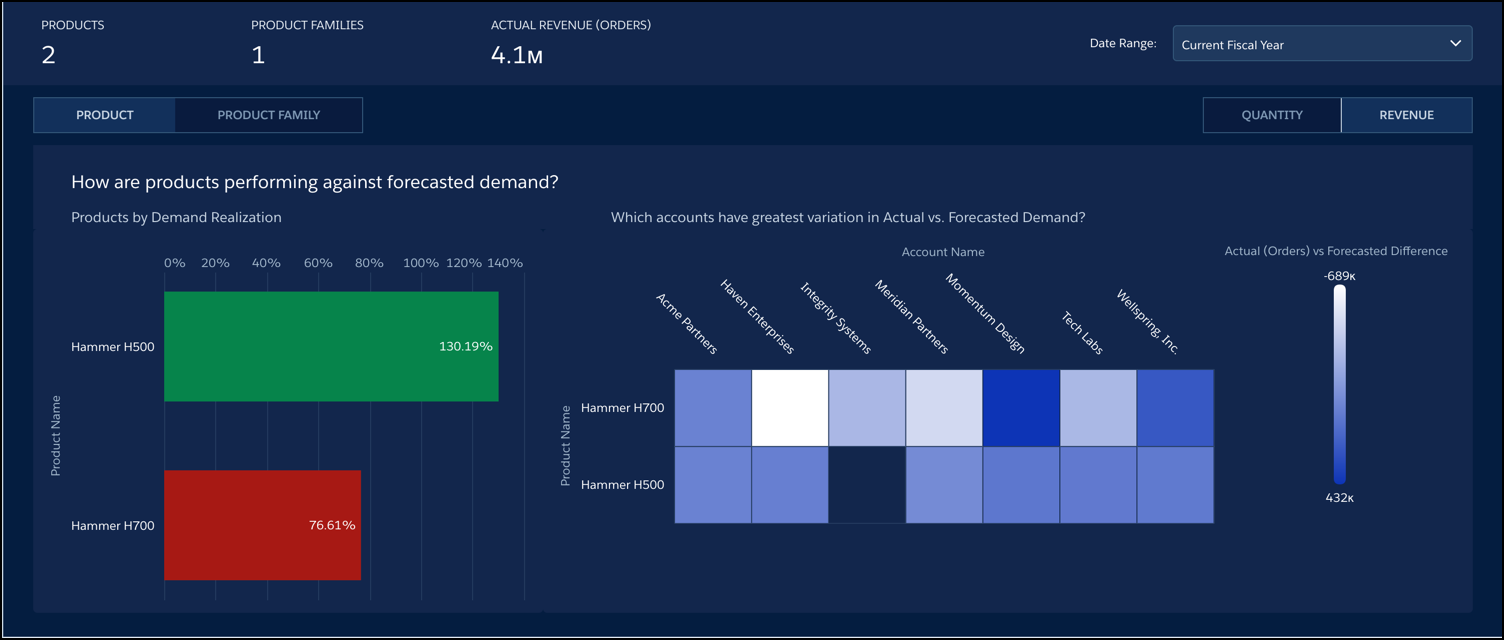
On the Actuals vs Forecast tab, Vance can again check product performance using similar metrics. While the previous dashboard derived data from sales agreements, this dashboard derives its data from account-based forecasts. Vance sets the date range to Current Fiscal Year to get the latest forecast numbers.
While Hammer H500 has a demand realization of over 140%, Hammer H700 has a realization of only 60%. The actual vs forecasted revenue difference is extremely high for Hammer H700 for Meridian Partners while Momentum Design is doing good in that area. The color gradient for Hammer H500 is similar for both accounts.
The month-on-month trend for demand realization shows the big picture. The overall demand is actually pretty high for the two products. In some months, the actual revenue has been higher than the forecasted revenue, and the overall difference is just under a million dollars. While the forecasted demand was $5 million, Rayler Parts managed to realize orders worth $4 million this fiscal year.

Peek into the Past
Vance understands that Hammer H700 is a product with a lot of potential. Before he looks at competitive pricing for the product, he checks its past data. Vance is in the last quarter of the current fiscal year and wants to see how Hammer H700 worked out for Meridian Partners in the last quarter of the previous fiscal year. This would help him understand where he might have gone wrong and how he can create a more realistic forecast this time around.
- On the Product Demand dashboard, Vance sets the date range to match the last 4 months of the previous fiscal year by selecting Custom. He also sets the global filter Account Name to Meridian Partners.
- On the Forecasted Demand tab, he sees that actuals were persistently higher than forecasted revenue, reaching a peak during November.

On the Planned Demand tab, Vance switches his view to Quantity to analyze which sales agreements had the most planned quantity for Hammer H700 during the last quarter of the previous year. He also checks the Details table to find specific numbers. For all sales agreements, there’s a 3-unit difference on an average between the planned and the actual revenue. Cumulatively, that’s a considerable gap.

Gain Insights into Pricing
Vance has one last analysis left. He wants to see how competitive his prices are for Hammer H700 and whether he should revisit the sales price and discount with Meridian Partners. To find this out, he selects the Pricing Insights tab. The tab provides two views, Price Trends and Price Elasticity.
The sales price of a product as derived from a sales agreement depends on two factors, variation in quantity and seasonality. The Price Trends view helps you see the trend of a particular product for specific quantity ranges so you can eliminate the quantity variation and focus on price changes.
Vance selects the product Hammer H700 and the quantity range 6-9 as that’s the typical quantity sold. He also sets the Compare toggle to On and selects the account Meridian Partners. This shows him the average price trend across accounts in comparison with the price offered to Meridian Partners. Vance can also see the minimum, average, and maximum price points, both for Meridian and across accounts. Vance realizes he is very close to the average price.

The Price Elasticity view confirms his thought. For a mid-size quantity, the price of Hammer H700 offered across accounts is slightly higher than that offered to Meridian Partners.

He keeps this in mind for the upcoming renewal of Meridian Partners’ sales agreements. The point-and-click analysis has helped him understand how he can keep his prices and products competitive, and improve his accounts’ performance.
Learn and Evolve
With the analysis of Meridian Partners complete, Vance is ready to submit his findings to Elliott in the next account planning meeting. With a few clicks, he was able to assess the account, its position among other accounts, product relationships, past performance, future forecasts, sales agreements, orders, opportunities, and so much more.