Get a High-Level View of Your Accounts
Learning Objectives
After completing this unit, you’ll be able to:
- Check the performance of your accounts.
- Analyze data on the Accounts’ Health dashboard.
Want to Get Hands-on with Manufacturing Cloud?
In this module, we show you the steps to use CRM Analytics dashboards in Manufacturing Cloud. We don’t have any hands-on challenges in this module, but if you want to practice and try out the steps, you can register for a free Manufacturing Cloud trial with sample data. A Trailhead Playground doesn’t have Manufacturing Cloud. Here’s how to get the free trial edition now.
- Sign up for a free 30-day Manufacturing Cloud trial.
- Fill out the form completely.
- For Email, enter an active email address that’s unknown to Salesforce. The email address you provide becomes the username in this new trial org. Usernames must be globally unique across all instances of Salesforce, so you must use an email account that is unknown to Salesforce or your installation won’t work.
- For Email, enter an active email address that’s unknown to Salesforce. The email address you provide becomes the username in this new trial org. Usernames must be globally unique across all instances of Salesforce, so you must use an email account that is unknown to Salesforce or your installation won’t work.
- After you fill out the form, click Submit. A confirmation message appears.
- When you receive the activation email (this might take a few minutes), open it and click Verify Account.
- Complete your registration by setting your password and challenge question. Tip: Write down your username, password, and login URL for easy access later.
- You are logged in to your trial org.

Gain Insights with CRM Analytics Dashboards
Cindy Jones is the admin at Rayler Parts. She has already set up CRM Analytics for Manufacturing Cloud in Rayler Parts’ org and added easy-to-access dashboards, which account managers can use to analyze different facets of the business.
In this module, you follow Elliott Drake, Head of Sales, AMER, as he explores the dashboards and gains actionable insights into his business. He’s already met Cindy to understand how to use the analytics app. Here are a few questions Elliott is asking.
- Which accounts and products contribute to low sales?
- What are the areas for growth in revenue and profit?
- What are the competitive prices at which certain products can be sold?
- What’s the difference between planned, forecasted, and actual revenue and quantity?
- How accurate are forecasts for accounts and products?
- Which accounts and products can be sold more?
Elliott logs into the Manufacturing application and finds the Key Account Manager Home dashboard embedded on the landing page. He starts exploring one dashboard at a time.

When you log in to your special org the first time or add dashboards to a record page, you may not see any dashboard data. It can take some time for CRM Analytics to sync data and fill the dashboards. Click  after about 10 minutes to view dashboard data.
Check the Health of Your Accounts
Elliott starts with the Accounts’ Health card and opens it from the Manufacturing app home page.
The Accounts’ Health dashboard gives you a glimpse of the overall business. Elliott wants to look at how his trusted key account manager, Vance, is performing. Vance has been dealing with Meridian Partners, a distributor of Rayler Parts’ attachments to industrial sectors. Elliott clicks the global filter Account Owner and selects Vance. This returns dashboards specific to Vance and his accounts.
Elliott starts with the Overview tab on the Accounts’ Health dashboard, where he can check the performance of accounts in two different ways.
- On the Planned Business card, he can compare actual revenue and quantity with planned revenue and quantity, so he understands how his business is performing against the plan.
- On the Sales Forecast card, he can compare the actuals with forecasted revenue and quantity, so he understands how his business is performing against forecast.
He can click View Dashboard on either card to switch between the two analytics views.
Elliott notes that for accounts Acme Partners and Meridian Partners, the difference between planned and actual revenue for the current fiscal year is $6.5 million. While Acme Partners has a revenue realization of around 110% against the business plan, Meridian Partners has a revenue realization below 50%. The revenue trend over the current fiscal year and the month of June shows that the actual revenue is more than the planned revenue.

For the two accounts, the difference between forecasted and actual revenue in the current fiscal year is $2.7 million. While Acme Partners has an attainment of around 150%, Meridian Partners has an attainment rate of over 50%. Attainment is the actual revenue displayed as a percentage of forecasted revenue. From the trend chart, Elliott notes that the planned revenue has been higher than the forecasted and actual revenue throughout the current fiscal year.

Based on his analysis, Elliott concludes that for the next year, his team should plan numbers similar to the forecasted revenue. Maybe it’s time to estimate better? He digs deeper into Vance’s accounts to find out more about them.
Check Which Accounts Need Your Attention
Elliott switches to the Accounts in Focus tab. He still has the global filter set to Vance’s accounts. On this tab, Elliott can see how much revenue is outstanding for Vance’s accounts and their actual versus planned revenue. These values are derived from the active sales agreements of an account. Elliott toggles between month, quarter, and year to check how much revenue is flowing in from sales agreements that are expiring soon.
For sales agreements expiring this year, Elliott observes that Acme Partners is well-placed and won’t have any outstanding revenue, while Meridian Partners has an outstanding revenue of $5.7 million. The difference between planned and actual revenue is significant for Meridian Partners and it’s negatively impacting Vance’s overall sales, even though Acme Partners is performing well.

Elliott also notices that, based on past schedules of all active sales agreements, Acme Partners has been a consistent customer and their order inflow equals the planned quantity. Meridian Partners accounts for almost 90% of actual-versus-planned revenue difference and is one of the worst-performing accounts at Rayler Parts. Vance must follow up with Meridian Partners and get more orders flowing in.

Elliott is curious to know how much these accounts contribute to the overall lifetime value of Rayler Parts.
Strengthen Customer Relationships
Customer Lifetime Value (CLV) is the sum of revenue generated to date and the revenue anticipated from an account. To calculate anticipated revenue, multiply planned revenue by the historical performance of the account (past realization). Elliott clicks the My Account Relationships tab to find out more.
This tab shows the duration of sales agreements for Vance’s accounts.
- Meridian Partners has sales agreements of 5 years with Rayler Parts and has completed over 2.8 years.
- Acme Partners has sales agreements spanning over 4 years and is almost in its third year.
Based on the duration, the tab calculates planned revenue starting the next day and the actual revenue till date. It also shows the place of each account in the overall customer lifetime value chart. Elliott notices that while Meridian Partners is below the average customer lifetime value, Acme Partners is above it.
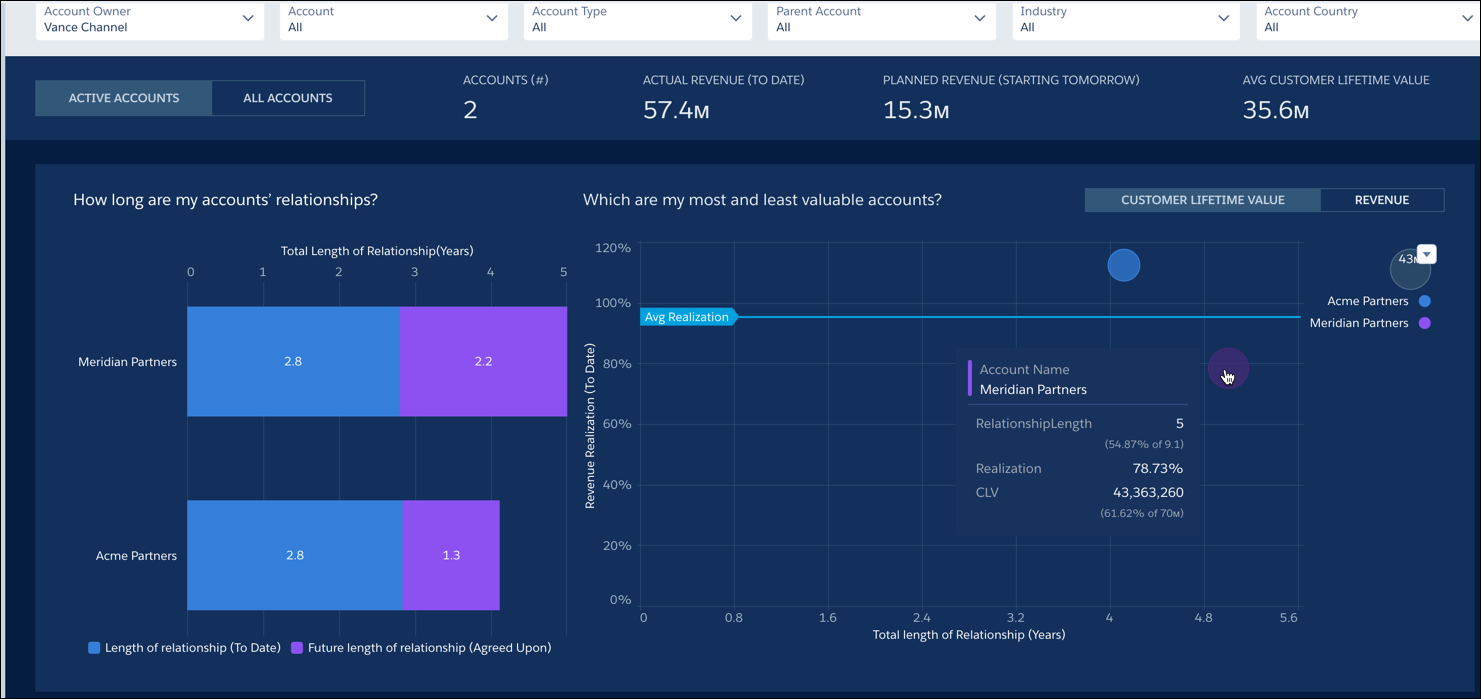
All the more proof to concentrate on Meridian Partners for the remaining 2 years. Elliott is glad that he could gather so much information with just a few clicks!
Elliott shares his observations with Vance and suggests gathering more details about Meridian Partners.
Resources